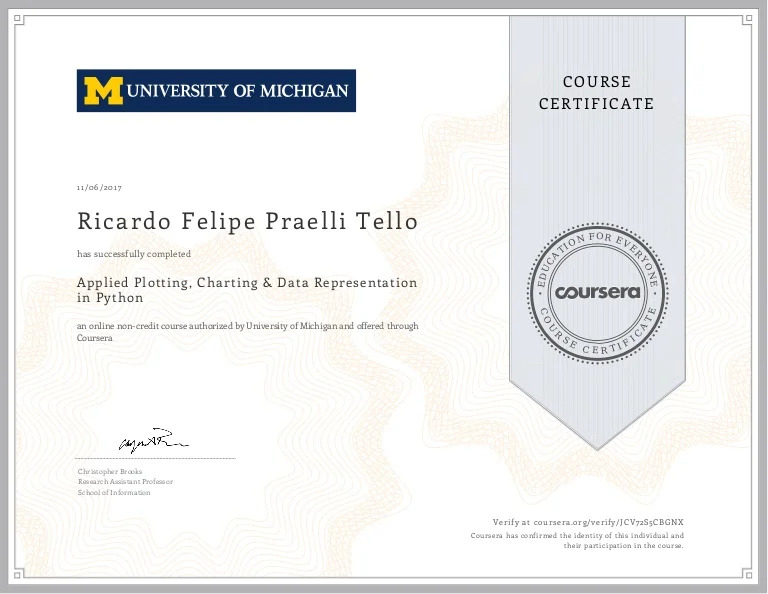
Applied Plotting, Charting & Data Representation in Python by University of Michigan (Coursera)

On the top of the list of the Best Online Charting Courses is Applied Plotting, Charting & Data Representation in Python by University of Michigan (Coursera). This course will introduce the learner to the fundamentals of information visualization, with an emphasis on reporting and charting using the matplotlib toolkit. The course will begin with a design and information literacy viewpoint, discussing what constitutes a good and terrible visualization, as well as how statistical metrics transfer into visualizations. The course will conclude with a review of other methods of organizing and showing data. After the lectures, you will know how to approach the problem based on the requirements.
This course comes after Introduction to Data Science in Python and before the remaining Applied Data Science with Python courses: Applied Machine Learning in Python, Applied Text Mining in Python, and Applied Social Network Analysis in Python.
Rating: 4.5/5 stars (5.985 ratings)
Highlights:
- Investigate graphical and design heuristics and methods for effective outcomes.
- Work with real-world datasets for practical projects.
- Pose research questions in the final project and find answers using dashboards.
- Learn the finest techniques for making professional-level charts.
Price: enroll for free.
Total duration: 21 hours (in 4 weeks).
Enroll here: https://www.coursera.org/learn/python-plotting


