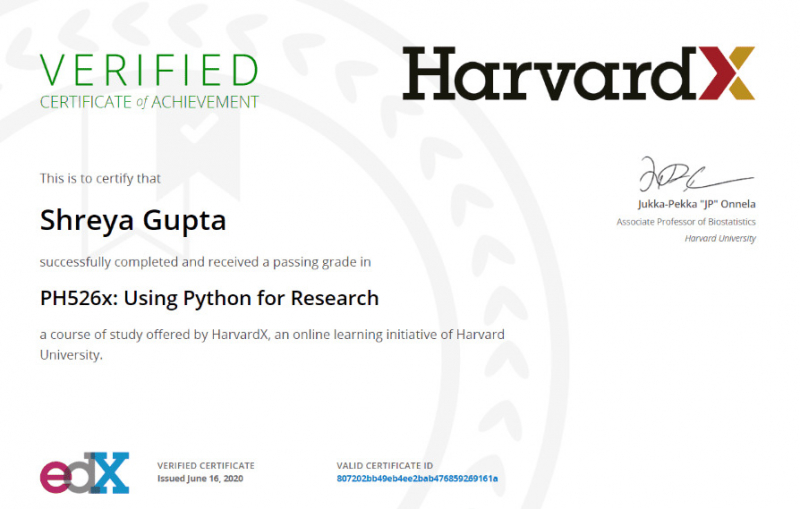
Using Python for Research (Harvard University)

This course bridges the gap between Python introductory and advanced courses. While there are many excellent introductory Python courses available, most do not go deep enough to allow you to apply your Python knowledge to research projects. After reviewing the fundamentals of Python 3, you will learn about tools commonly used in research settings in this course.
A new module on statistical learning is included in this version of the course. You will get to practice your new Python skills with various case studies chosen for their scientific breadth and coverage of different Python features, using a combination of a guided introduction and more independent in-depth exploration.
What You’ll Learn
- The course starts with a basic review of Python 3, in order to bring everyone up to speed, in preparation for the following weeks. Before that, however, you are recommended to take a self-assessment quiz to see if the course is a good fit for you.
- In week 2, you’ll start by studying scopes in Python. You’ll then jump into bona fide scientific computing with NumPy, learning about vectorization (an important optimization technique to process calculations in bulk), and you’ll create plots with matplotlib, a very popular visualization library in Python.
- In weeks 3 and 4, you’ll explore specific examples of how Python can be applied in research — study cases, if you will. This exploration will involve topics such as DNA translation, language processing (NLP), classification problems, studying bird migration with GPS data tracking, and social network analysis, among others.
- Finally, you’ll explore statistical learning. With SciPy, you’ll learn and apply the basics of linear and logistic regression, and learn how to use random forests to analyze a movie dataset.
How You’ll Learn
- The course is 5 weeks long and you are expected to spend 2 to 4 hours each week on it. Video lectures and project materials are provided as resources, and in each week you’ll be given one or more homework assignments to complete.
- There'll be final project that you’ll have to complete as a verified learner.
Fun Facts
- The course instructor, Jukka-Pekka "JP" Onnela, was awarded the NIH Director's New Innovator Award in 2013 for his work in digital phenotyping.
- It may not come as a surprise then that he’s Associate Professor of Biostatistics at Harvard University.
Rating: 4.0
Enroll here: pll.harvard.edu/course/using-python-research?delta=0


