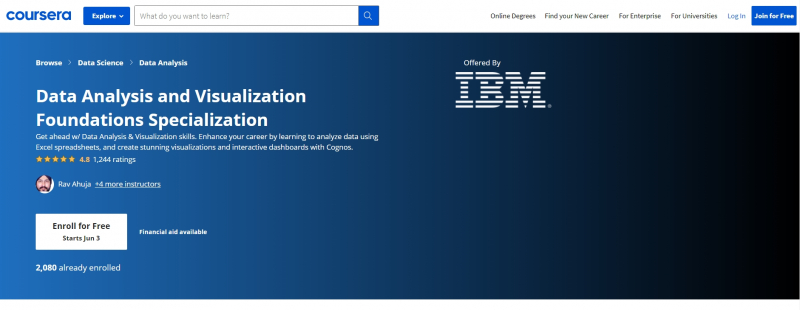
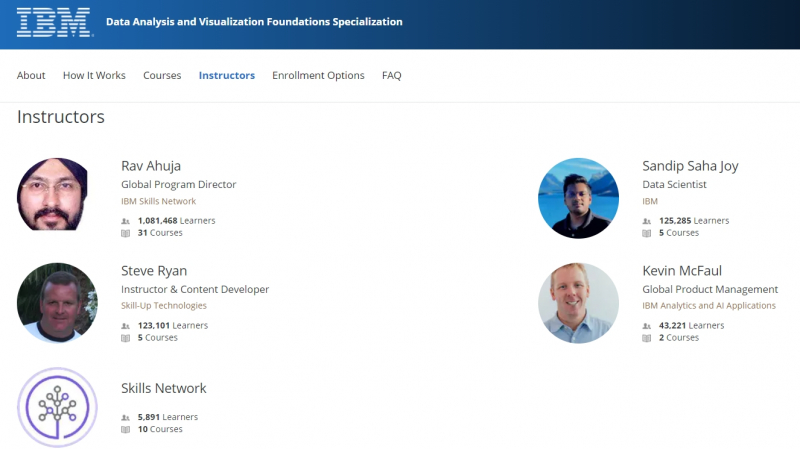
Data Analysis and Visualization Foundations Specialization by IBM

With the first place on the list of Best Online Data Analysis Courses, You'll learn about the modern data ecosystem within this course, which consists of databases and other data sources both inside and outside your company. By becoming familiar with spreadsheets such as Excel, you will have the abilities necessary to begin data analysis activities successfully. You'll look at a variety of data sets, put them into a spreadsheet, and use techniques like summarization, sorting, filtering, and pivot table creation.
Creating eye-catching visuals is an important element of effectively presenting your data analysis findings. Many various sorts of data visualizations, such as line plots, bar charts, and pie charts, will be created using Excel spreadsheets. Advanced visualizations such as treemaps, scatter charts, and map charts will also be created. With IBM Cognos Analytics, you'll be able to create interactive dashboards fast and efficiently.
This course offers:
- Flexible Schedule: Set and maintain flexible deadlines.
- Certificate : Earn a Certificate upon completion
- 100% online
- Beginner Level
- Approx. 4 months to complete: Suggested pace of 2 hours/week
- Subtitles: English, Arabic, French, Portuguese (European), Italian, Vietnamese, German, Russian, Spanish
Coursera Rating: 4.7/5
Enroll here: https://www.coursera.org/specializations/data-analysis-visualization-foundations