Top 9 Best Online Data Analysis Courses

Are you wondering which remote classroom to attend? You have spare time and want to broaden your horizon about a specific field of study whilst just staying at ... read more...home. Thus, to satisfy the burgeoning demand for online yet qualifying courses, Toplist has complied a rundown of the Best Online Data Analysis Courses offered by the prestigious universities, famous companies, top organizations and knowledgeable instructors across the globe for who in need!!!
-
With the first place on the list of Best Online Data Analysis Courses, You'll learn about the modern data ecosystem within this course, which consists of databases and other data sources both inside and outside your company. By becoming familiar with spreadsheets such as Excel, you will have the abilities necessary to begin data analysis activities successfully. You'll look at a variety of data sets, put them into a spreadsheet, and use techniques like summarization, sorting, filtering, and pivot table creation.
Creating eye-catching visuals is an important element of effectively presenting your data analysis findings. Many various sorts of data visualizations, such as line plots, bar charts, and pie charts, will be created using Excel spreadsheets. Advanced visualizations such as treemaps, scatter charts, and map charts will also be created. With IBM Cognos Analytics, you'll be able to create interactive dashboards fast and efficiently.This course offers:
- Flexible Schedule: Set and maintain flexible deadlines.
- Certificate : Earn a Certificate upon completion
- 100% online
- Beginner Level
- Approx. 4 months to complete: Suggested pace of 2 hours/week
- Subtitles: English, Arabic, French, Portuguese (European), Italian, Vietnamese, German, Russian, Spanish
Coursera Rating: 4.7/5
Enroll here: https://www.coursera.org/specializations/data-analysis-visualization-foundations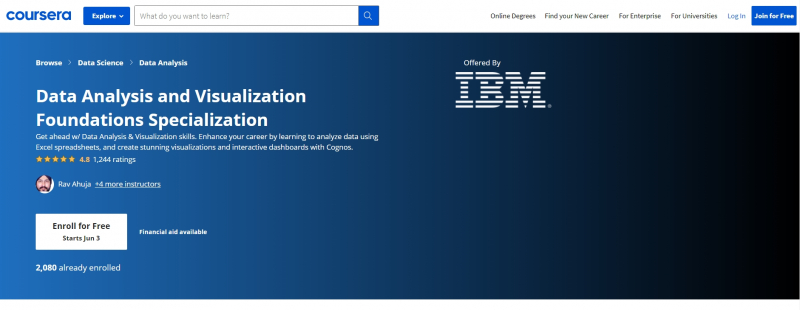
https://www.coursera.org 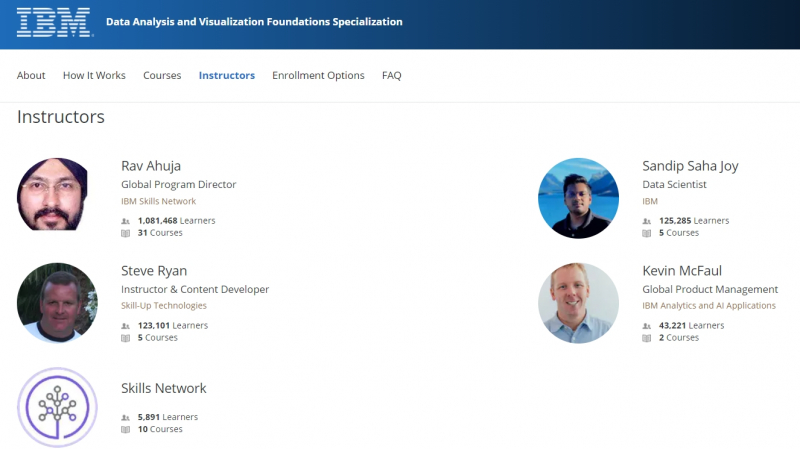
https://www.coursera.org - Flexible Schedule: Set and maintain flexible deadlines.
-
If you are a PwC employee, follow the instructions on Vantage to get free access to the PwC Specialization and Courses. Data Analysis and Presentation Skills: the PwC Approach Specialization offered by PwC will teach you how to apply data analysis in the real world, allowing you to turn business intelligence into actionable results.
Learners will look at how a combination of greater data interpretation, filtering, and application can help you solve problems faster, resulting in more informed and successful decision-making. We'll teach you how to utilize Microsoft Excel, PowerPoint, and other standard data analysis and communication tools, as well as how to present data to others in a way that engages them in your story and motivates them to act.
This course offers:
- Flexible Schedule: Set and maintain flexible deadlines.
- Certificate : Earn a Certificate upon completion
- 100% online
- Beginner Level
- Approx. 6 months to complete: Suggested pace of 3 hours/week
- Subtitles: English, Arabic, French, Portuguese (European), Italian, Vietnamese, Korean, German, Russian, Turkish, Spanish, Japanese
Coursera Rating: 4.7/5
Enroll here: https://www.coursera.org/specializations/pwc-analytics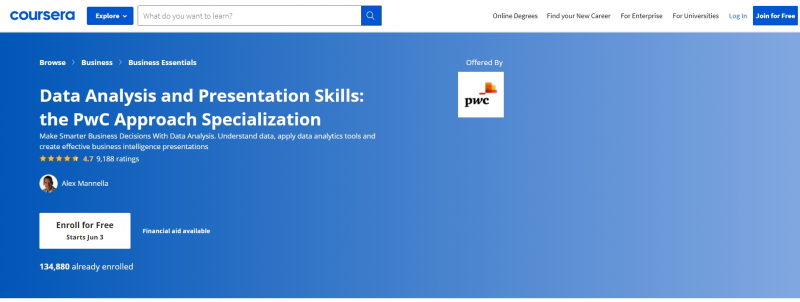
https://www.coursera.org 
https://www.coursera.org - Flexible Schedule: Set and maintain flexible deadlines.
-
In just four project-based courses, the Data Analysis and Interpretation Specialization, one of the Best Online Data Analysis Courses, will take you from data novice to data expert. You'll use SAS or Python, including pandas and Scikit-learn, to apply basic data science methods like data management and visualization, modeling, and machine learning. Throughout the Specialization, you will examine and summarize your findings on a research issue of your choice. You will use real data to address an important societal issue in the Capstone Project, and you will present your results in a professional-quality report. You will have the opportunity to collaborate with DRIVENDATA and The Connection, two of our industry partners.
Join one of DRIVENDATA's competitions to help them address some of the world's most pressing social issues, or help The Connection better understand recidivism risk for persons on parole in drug abuse treatment. Regular peer comments will give you the opportunity to change your query. This Specialization is intended to assist you whether you are pursuing a career in data, work in an environment where your bosses rely on you for data insights, or simply have some burning issues you want to investigate. It is not necessary to have any prior experience. You will have mastered statistical approaches to conduct original research and make challenging decisions by the conclusion of the course.
This course offers:
- Flexible Schedule: Set and maintain flexible deadlines.
- Certificate : Earn a Certificate upon completion
- 100% online
- Beginner Level
- Approx. 5 months to complete: Suggested pace of 3 hours/week
- Subtitles: English, Arabic, French, Portuguese (European), Italian, Vietnamese, Korean, German, Russian, Spanish
Coursera Rating: 4.7/5
Enroll here: https://www.coursera.org/specializations/data-analysis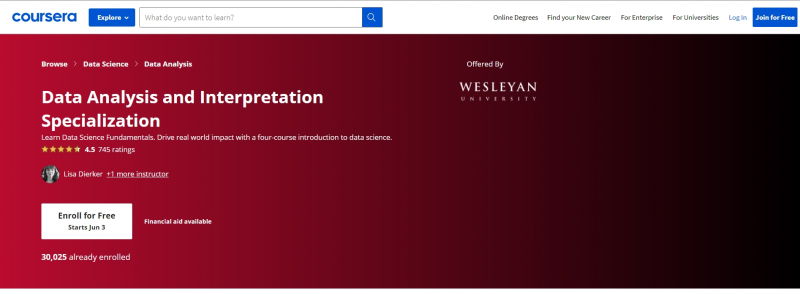
https://www.coursera.org 
https://www.coursera.org - Flexible Schedule: Set and maintain flexible deadlines.
-
Perhaps you're new to SQL and want to brush up on the fundamentals. Or perhaps you've already used SQL to query data in relational databases on a lesser scale. In any case, if you're interested in learning how to query massive data using modern distributed SQL engines, this Specialization is for you.
Most SQL courses focus on traditional relational databases, but today's data is becoming too large to be stored in them, and it's growing too quickly to be stored efficiently in commercial data warehouses. Instead, it's being stored in dispersed clusters and cloud storage more and more. These data storage systems are both inexpensive and infinitely scalable.You'll need a fresh breed of SQL engine to query these massive datasets in clusters and cloud storage: distributed query engines like Hive, Impala, Presto, and Drill. These are SQL engines that are open source and capable of querying massive datasets. The most extensively used query engines, Hive and Impala, are the subject of this Specialization.
Modern Big Data Analysis with SQL Specialization offered by Cloudera is intended to help you pass the Cloudera Certified Associate (CCA) Data Analyst certification exam. This certification credential can be obtained by passing a hands-on practical exam using the same SQL engines that this Specialization teaches—Hive and Impala.This course offers:
- Flexible Schedule: Set and maintain flexible deadlines.
- Certificate : Earn a Certificate upon completion
- 100% online
- Beginner Level
- Approx. 4 months to complete: Suggested pace of 3 hours/week
- Subtitles: English, Arabic, French, Portuguese (European), Italian, Vietnamese, German, Russian, Spanish
Coursera Rating: 4.8/5
Enroll here: https://www.coursera.org/specializations/cloudera-big-data-analysis-sql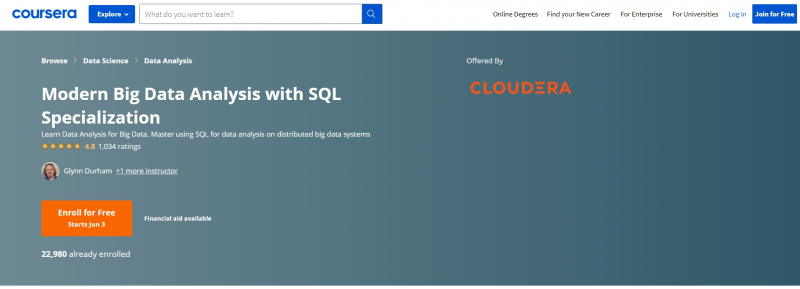
https://www.coursera.org 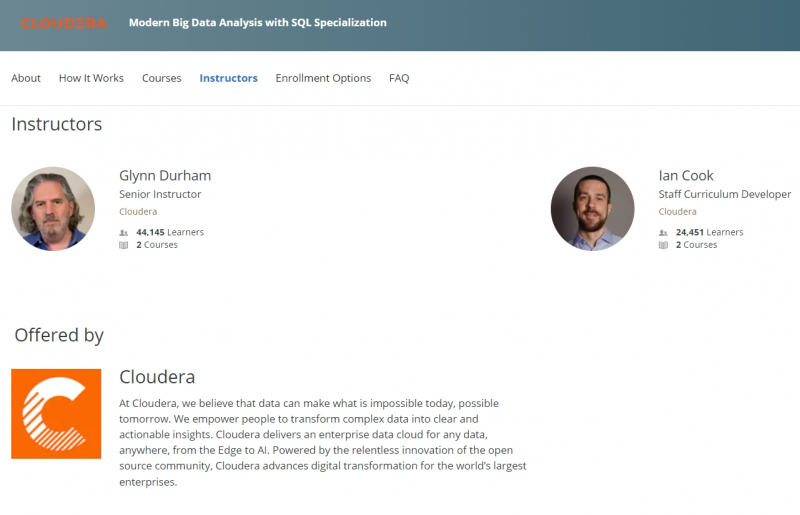
https://www.coursera.org - Flexible Schedule: Set and maintain flexible deadlines.
-
Python for Data Analysis: Pandas & NumPy offered by Coursera Project Network Learners ranks fifth on the list of Best Online Data Analysis Courses. Dung this course you will learn the principles of data analysis in Python and use the power of two essential Python libraries, Numpy and pandas, in this hands-on project. In data research, NumPy and Pandas are two of the most extensively used Python packages. They provide high-performance structures and data analysis tools that are simple to use.
Note: This course is best suited to students in the North American region. We're working on bringing the same experience to other parts of the world. In a video that plays in a split-screen with your work area, your instructor will walk you through these steps:- Task #1: define single and multi-dimensional NumPy arrays
- Task #2: leverage NumPy built-in methods and functions
- Task #3: perform mathematical operations in NumPy
- Task #4: perform arrays slicing and indexing
- Task #5: perform elements selection (conditional)
- Task #6: understand pandas fundamentals
- Task #7: pandas with csv and html data
- Task #8: pandas operations
- Task #9: pandas with functions
- Task #10: perform sorting and ordering in pandas
This course offers:
- Flexible Schedule: Set and maintain flexible deadlines.
- Certificate : Earn a Certificate upon completion
- 100% online
- Beginner Level
- Approx. 2 hours to complete
- Subtitles: English
Coursera Rating: 4.4/5
Enroll here: https://www.coursera.org/projects/python-for-data-analysis-numpy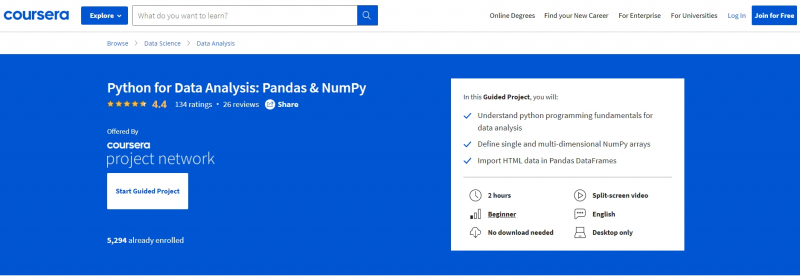
https://www.coursera.org 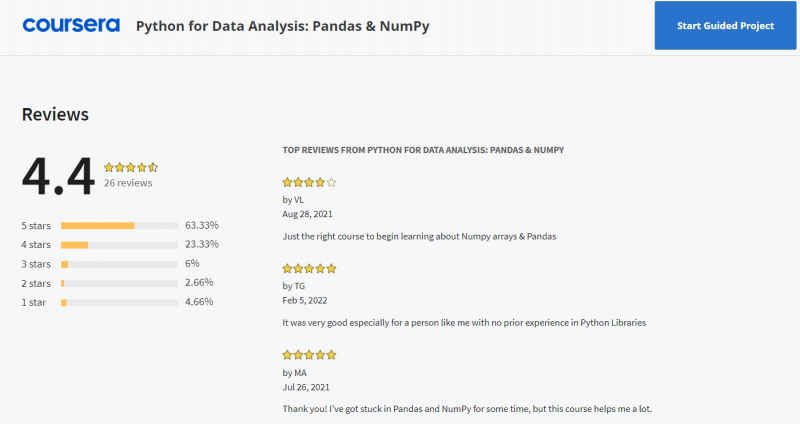
https://www.coursera.org - Task #1: define single and multi-dimensional NumPy arrays
-
With Data Analysis with R Specialization offered by Duke University, you'll learn to analyze and visualize data in R and create reproducible data analysis reports, demonstrate a conceptual understanding of the unified nature of statistical inference, perform frequentist and Bayesian statistical inference and modeling to understand natural phenomena and make data-based decisions, communicate statistical results correctly, effectively, and in context without relying on statistical jargon, and critique data-based claims in this Specialization.
You'll create a portfolio of data analysis projects from the Specialization that demonstrates mastery of statistical data analysis from exploratory analysis to inference to modeling, which you may use to apply for statistical analysis or data scientist jobs.
This course offers:
- Flexible Schedule: Set and maintain flexible deadlines.
- Certificate : Earn a Certificate upon completion
- 100% online
- Beginner Level
- Approx. 5 months to complete: Suggested pace of 2 hours/week
- Subtitles: English, Arabic, French, Portuguese (European), Italian, Vietnamese, Korean, German, Russian, Spanish
Coursera Rating: 4.7/5
Enroll here: https://www.coursera.org/specializations/statistics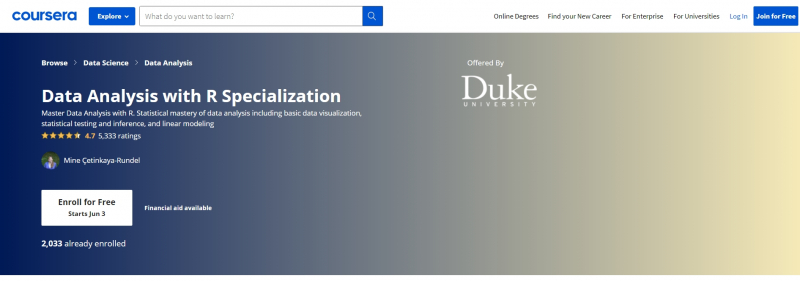
https://www.coursera.org 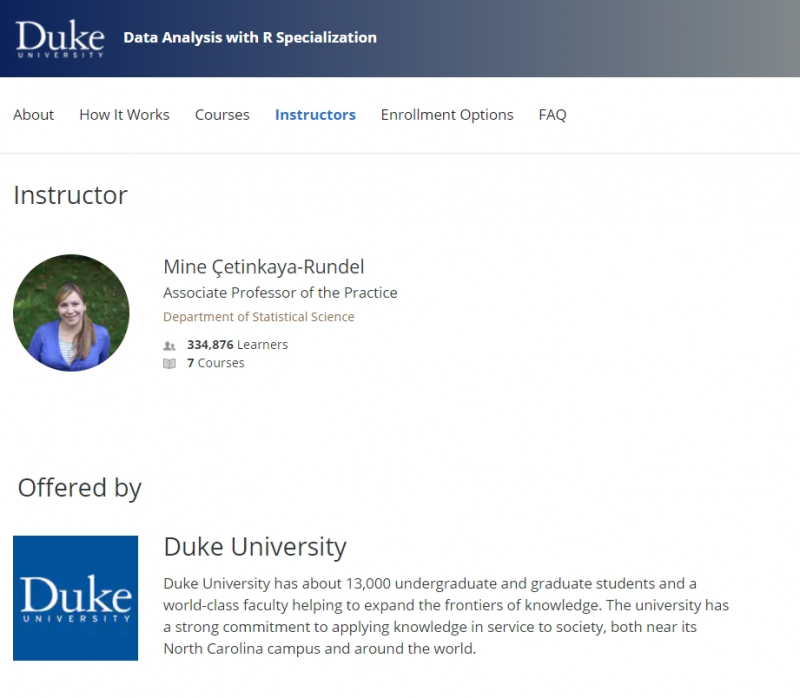
https://www.coursera.org - Flexible Schedule: Set and maintain flexible deadlines.
-
Data Analysis Using Python offered by University of Pennsylvania will teach you how to use Python to learn basic data science techniques. Students learn how to use data analysis tools such as pandas, numpy, and matplotlib, as well as essential concepts such as Data Frames and merging data. This course covers how to load, inspect, and query real-world data, as well as how to answer fundamental questions about it. Data aggregation and summarizing, as well as basic data visualization, will be taught to students.
After finishing this course you can apply basic data science techniques using Python, understand and apply core concepts like Data Frames and joining data, and use data analysis libraries like pandas, numpy, and matplotlib, and so on.
This course offers:
- Flexible deadlines: Set and maintain flexible deadlines.
- Certificate : Earn a Certificate upon completion
- 100% online
- Beginner Level
- Approx. 17 hours to complete
- Subtitles: English, Korean
- Course 2 of 4 in the Introduction to Programming with Python and Java Specialization
Coursera Rating: 4.6/5
Enroll here: https://www.coursera.org/learn/data-analysis-python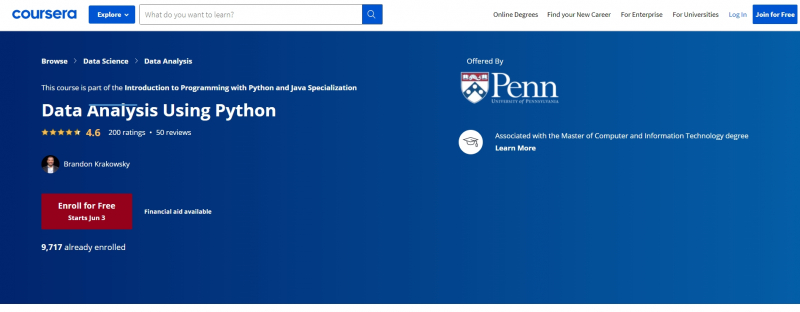
https://www.coursera.org 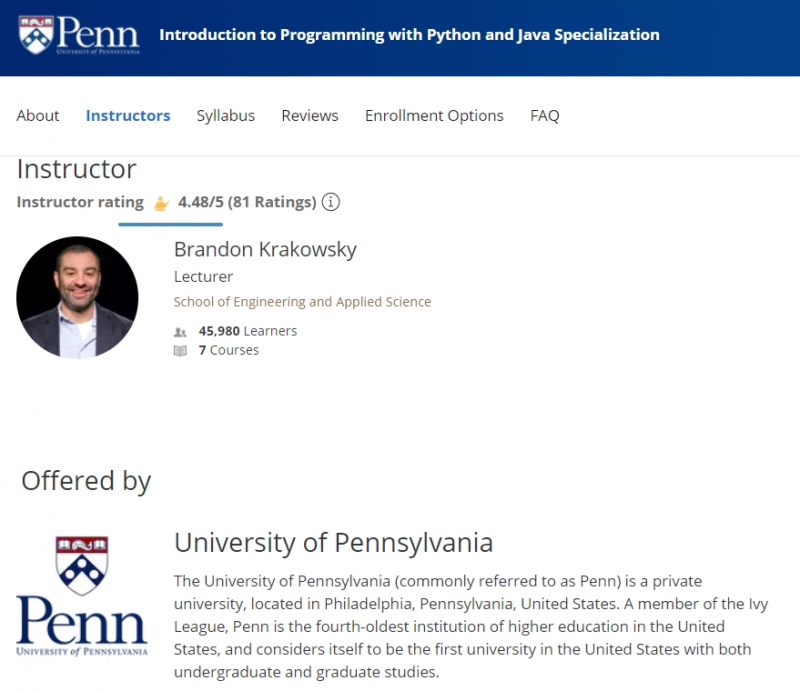
https://www.coursera.org - Flexible deadlines: Set and maintain flexible deadlines.
-
Excel is widely used in the business world. Excel is an extremely sophisticated data analysis tool, and practically all large and small firms utilize it on a daily basis. This is an introductory Excel course aimed to provide you a working knowledge of the program so that you can use it for more advanced topics in Business Statistics later. The course is aimed for two types of learners: individuals with little or no functional knowledge of Excel and those who use Excel on a regular basis but only in a peripheral way and want to improve their skills.
The course progresses from the fundamentals of Excel, such as reading data into Excel using multiple data formats, organizing and manipulating data, to some of the more complex features. Throughout the course, Excel functionality is presented through simple examples that are demonstrated in a way that allows learners to grow comfortable with understanding and applying it.
Students must have access to a Windows version of Microsoft Excel 2010 or later in order to complete course assignments.This course offers:
- Flexible deadlines: Set and maintain flexible deadlines.
- Certificate : Earn a Certificate upon completion
- 100% online
- Beginner Level
- Approx. 20 hours to complete
- Subtitles: Tamil, Arabic, French, Portuguese (European), Italian, Vietnamese, German, Russian, English, Spanish
- Course 1 of 5 in the Business Statistics and Analysis Specialization
Coursera Rating: 4.7/5
Enroll here: https://www.coursera.org/learn/excel-data-analysis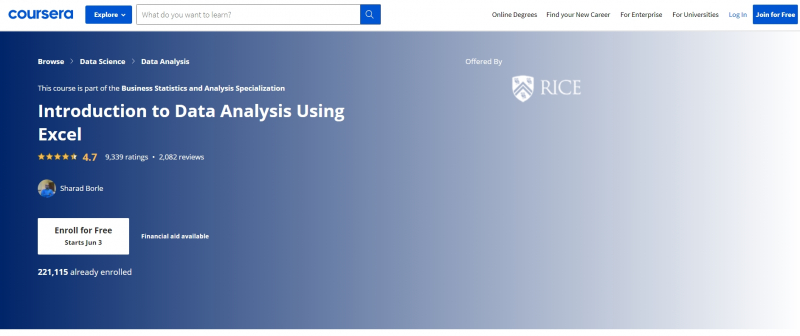
https://www.coursera.org 
https://www.coursera.org - Flexible deadlines: Set and maintain flexible deadlines.
-
Exploratory Data Analysis offered by Johns Hopkins University will teach you how to summarize data using exploratory strategies. These strategies are often used prior to the start of formal modeling and can aid in the construction of more complex statistical models. Exploratory procedures are also useful for weeding out or refining prospective world assumptions that can be addressed by data. Learners will go through the plotting systems in R in depth, as well as some of the fundamental ideas of data visualization. Learners will also go through some of the most common multivariate statistical approaches for visualizing data with a lot of dimensions.
This course offers:
- Flexible deadlines: Reset deadlines in accordance to your schedule.
- Certificate : Earn a Certificate upon completion
- 100% online
- Beginner Level
- Approx. 55 hours to complete
- Subtitles: Arabic, French, Portuguese (European), Chinese (Simplified), Italian, Vietnamese, Korean, German, Russian, English, Spanish
Coursera Rating: 4.7/5
Enroll here: https://www.coursera.org/learn/exploratory-data-analysis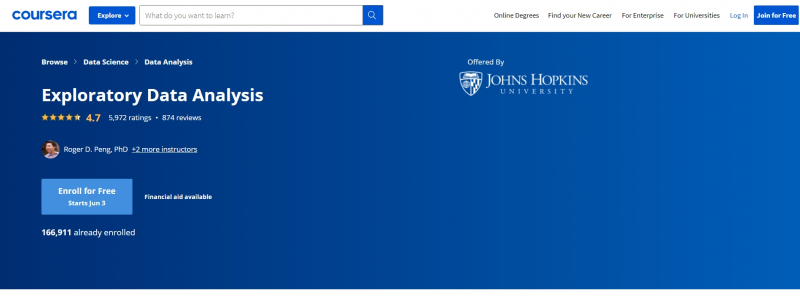
https://www.coursera.org/ 
https://www.coursera.org/ - Flexible deadlines: Reset deadlines in accordance to your schedule.