Data Visualization with Advanced Excel by PwC (Coursera)

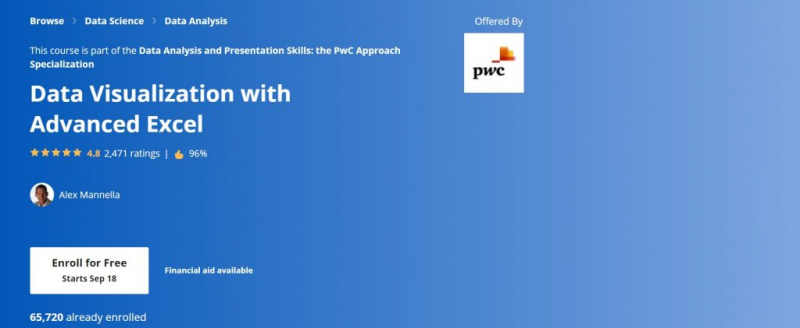
On Coursera, this course is part of the Data Analysis and Presentation Skills: the PwC Approach Specialization. It is the most effective course for learning Advanced Excel. It is divided into four sections in which you will receive hands-on training in advanced Excel 2013 functionalities as well as skills in using PowerPivot to develop databases and models. You will become acquainted with Excel's built-in features such as Solver, Data Tables, Scenario Manager, and Goal Seek. Finally, you'll discover Data Visualization, Graphs, and Power View Reports, as well as how to integrate them into dynamic dashboards.
The course modules are as follows:
1. Professional Excel Preparation — Covers data models and databases, as well as the PowerPivot tool.
2. Advanced Scenario Analysis — Examines various analytical approaches and how to use them.
3. Data Visualization - Detailed coverage of data visualization elements such as charts and graphs.
4. Dashboarding — Provides information on the design ideas and criteria for creating a dashboard.
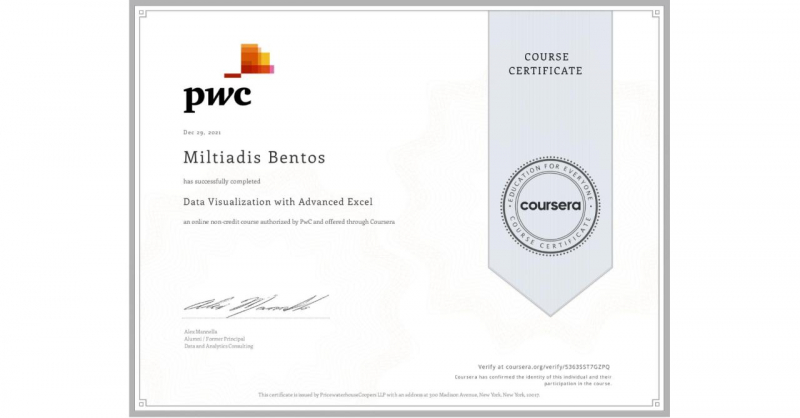
Alex Mannella teaches the course, which includes many graded exams and tasks with peer comments. At the completion of the course, you will receive an electronic Certificate.
Detailed information:
Cost: $79/month
Syllabus: Approx. 4 weeks, 3-4 hours / week
Link: https://www.coursera.org/learn/advanced-excel


