Microsoft Excel – Data Analysis with Excel Pivot Tables (Udemy)

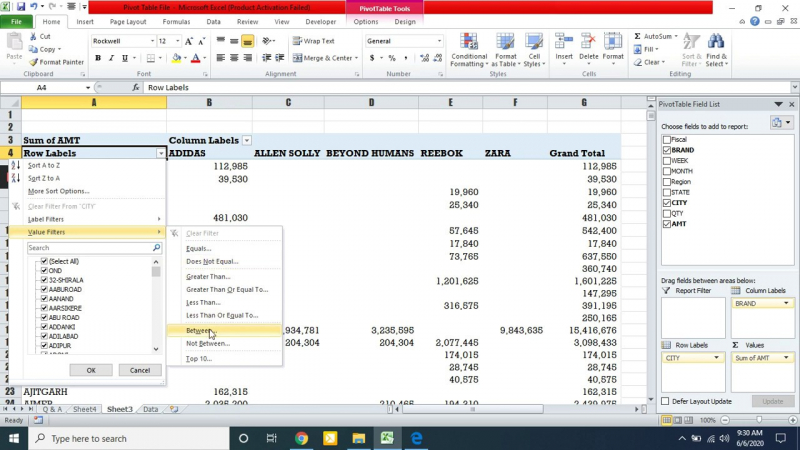
This course is a master class in Excel Pivot tables, one of the most sophisticated data analysis tools available in Excel. It is the greatest Excel course for taking your data analysis abilities to the next level. When, why, and how to use Excel Pivot Tables and Charts will be covered. You will learn how to examine and alter raw data in order to identify patterns, trends, and insights. The course reviews essential Pivot table capabilities like sorting, filtering, and grouping tools, conditional formatting, and calculated values using sample data from the IMDB Movie database. You will also learn about data visualization, as well as how to create interactive dashboards with Pivot Charts, Slicers, and Timelines.
The course also contains ten real-world case studies to demonstrate the concepts.
Chris Dutton, a Microsoft Certified, best-selling Excel instructor, created this Excel course and teaches it in a fun, engaging, and effective manner. Excel 2007, Excel 2010, Excel 2013, Excel 2016, Excel 2019, and Office 365 are all supported. It comes with Excel project files, 6 downloadable resources, 22 articles, homework assignments, and quizzes, as well as lifelong access to course content.
Detailed information:
Cost: $149.99 ($14.99 during regular flash sales)
Syllabus: 105 lessons, 11.5 hours video
Link: https://www.udemy.com/course/business-data-analysis-excel/


