MS Excel - Data Analytics and Simulations
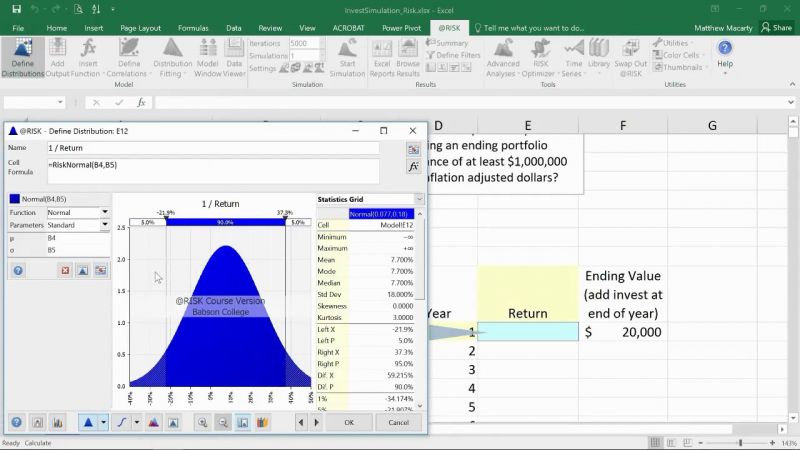
Excel simulations aid in the investigation of a real-life phenomenon, process, or problem through the use of a model. This method is automated, goal-oriented, interactive, and user-friendly. This approach to working with data makes it challenging, creative, and enjoyable. These simulations really bring out a lot of excel skills. These online tutorials are truly self-paced, and anyone can easily learn business intelligence, the importance of data trending, and how to create valuable data visualizations.
You will learn the entire simulation procedure, including functions such as Data Simulation, single reference simulation, grid reference simulation, chart simulation, goal seek, and so on. Descriptive Statistics, Mean Mode Median, Dispersion, Standard Deviation, Data Analysis Tool, Central Tendency and Dispersions Using Data Analysis, Correlation and Regression, Histogram Using Data Analysis, Moving Averages Using Data Analysis.
The course is designed to teach students advanced data sorting and filtering techniques, as well as how to use lookup functions and other essential functions. The training will instruct students on how to use statistical tools in Excel. Thus, both the training and the projects will walk you through the essential features of Excel and how to use them effectively.
Who this course is for:
- Commerce students
- Students from the business administration
- Working professionals who go through the hectic working schedule of same repetitive work every day
- Anyone who wants to learn excel simulations
Requirements
- Basic knowledge of excel tools and functions
- Passion to learn and apply
- MS Excel 2016 in your PC
Course ratings: 4.4/5
Enroll here: https://www.udemy.com/course/microsoft-excel-simulations/


