Data Science: Visualization

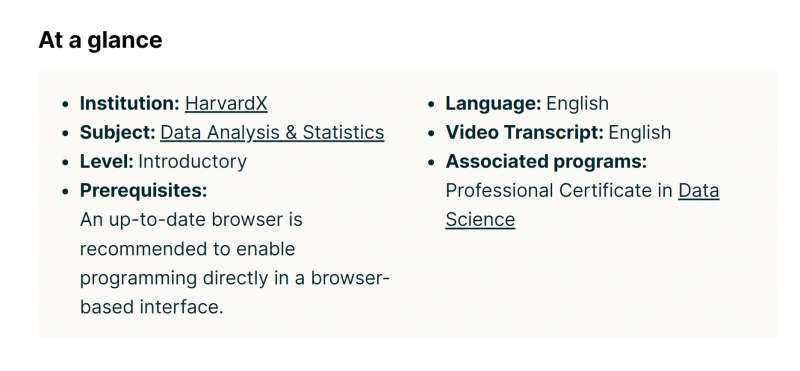
The first best online exploratory data analysis is Visualization. As part of the Professional Certificate Program in Data Science, the Visualization course covers the basics of data visualization and exploratory data analysis. The course will use three motivating examples and ggplot2, a data visualization package for the statistical programming language R. It will start with simple datasets and then graduate to case studies about world health, economics, and infectious disease trends in the United States.
The growing availability of informative datasets and software tools has led to increased reliance on data visualizations across many areas. Data visualization provides a powerful way to communicate data-driven findings, motivate analyses, and detect flaws. This course will give you the skills you need to leverage data to reveal valuable insights and advance your career.
What you will learn:
- Skip What you'll learn
- Data visualization principles
- How to communicate data-driven findings
- How to use ggplot2 to create custom plots
- The weaknesses of several widely-used plots and why you should avoid them
This course offers:
- Flexible deadlines: Reset deadlines based on your availability.
- Get a Certificate when you complete
- 100% online
- Intermediate level
- A part of the Professional Certificate Program in Data Science
- Approximately 8 weeks to complete
- Subtitles: English
Participants: 229,405
Enroll here: https://www.edx.org/course/data-science-visualization