Exploratory Data Analysis in Python: Datacamp
Exploratory data analysis is a process for exploring datasets, answering questions, and visualizing results. And Exploratory Data Analysis in Python in Datacamp is among the best online exploratory data analysis courses. This course presents the tools you need to clean and validate data, visualize distributions and relationships between variables, and use regression models to predict and explain.
You'll explore data related to demographics and health, including the National Survey of Family Growth and the General Social Survey. But the methods you learn apply to all areas of science, engineering, and business. You'll use Pandas, a powerful library for working with data, and other core Python libraries including NumPy and SciPy, StatsModels for regression, and Matplotlib for visualization. With these tools and skills, you will be prepared to work with real data, make discoveries, and present compelling results.
You will learn:
- Read the data, check for errors and special cases, and prepare data for analysis.
- Began exploring it by using histograms to visualize distributions
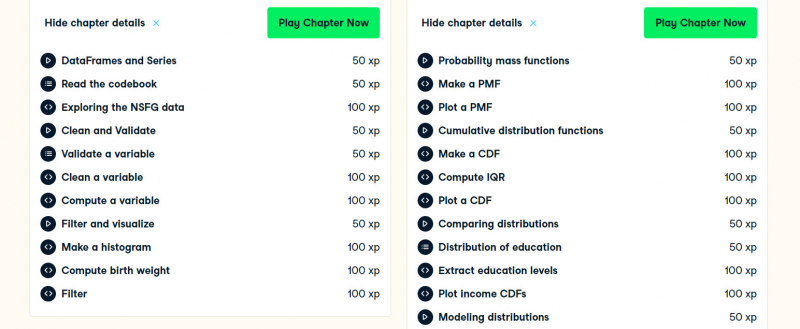
- Represent distributions using Probability Mass Functions (PMFs) and Cumulative Distribution Functions (CDFs)
- Explore relationships between variables two at a time, using scatter plots and other visualizations to extract insights from a new dataset obtained from the Behavioral Risk Factor Surveillance Survey (BRFSS)
- Explore multivariate relationships using multiple regression to describe non-linear relationships and logistic regression to explain and predict binary variables.
This course offers:
- Flexible deadlines: Reset deadlines based on your availability.
- Get a Certificate when you complete
- 100% online
- Beginner level
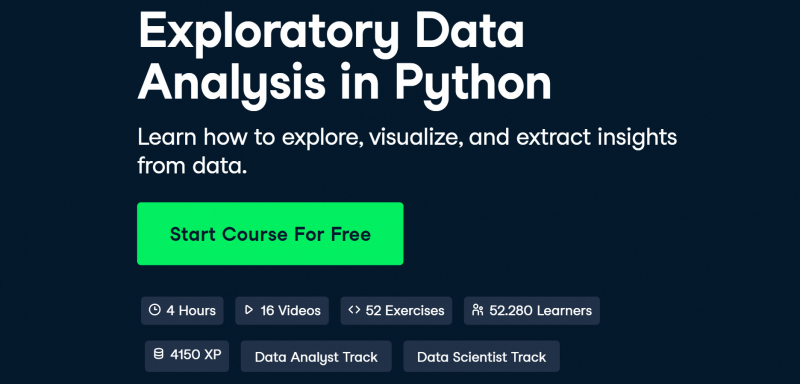
- Approximately 4 hours to finish
- Subtitles: English
Participants: 52,280
Enroll here: https://www.datacamp.com/courses/exploratory-data-analysis-in-python


