Top 8 Best Online Exploratory Data Analysis Courses

Are you wondering which remote classroom to attend? You have spare time and want to broaden your horizon about a specific field of study whilst just staying at ... read more...home. Thus, to satisfy the burgeoning demand for online yet qualifying courses, Toplist has compiled a rundown of the Best Online Exploratory Data Analysis Courses offered by the famous companies, top organizations, and knowledgeable instructors across the globe for those who are in need!
-
The first best online exploratory data analysis is Visualization. As part of the Professional Certificate Program in Data Science, the Visualization course covers the basics of data visualization and exploratory data analysis. The course will use three motivating examples and ggplot2, a data visualization package for the statistical programming language R. It will start with simple datasets and then graduate to case studies about world health, economics, and infectious disease trends in the United States.
The growing availability of informative datasets and software tools has led to increased reliance on data visualizations across many areas. Data visualization provides a powerful way to communicate data-driven findings, motivate analyses, and detect flaws. This course will give you the skills you need to leverage data to reveal valuable insights and advance your career.
What you will learn:
- Skip What you'll learn
- Data visualization principles
- How to communicate data-driven findings
- How to use ggplot2 to create custom plots
- The weaknesses of several widely-used plots and why you should avoid them
This course offers:
- Flexible deadlines: Reset deadlines based on your availability.
- Get a Certificate when you complete
- 100% online
- Intermediate level
- A part of the Professional Certificate Program in Data Science
- Approximately 8 weeks to complete
- Subtitles: English
Participants: 229,405
Enroll here: https://www.edx.org/course/data-science-visualization
edx.org 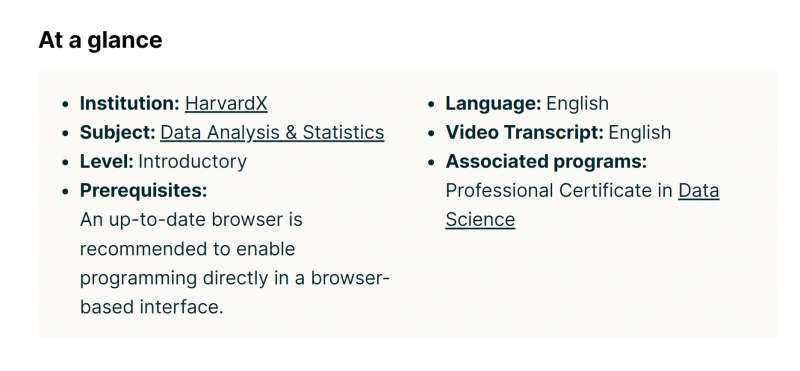
edx.org -
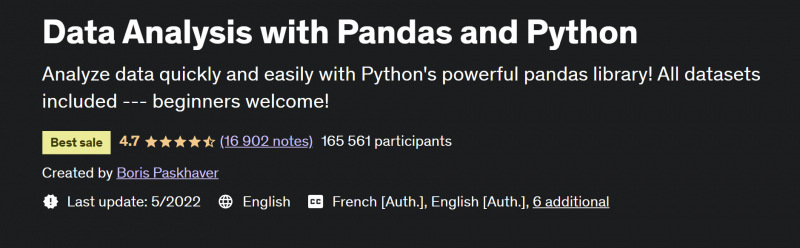
If you've spent time in spreadsheet software like Microsoft Excel, Apple Numbers, or Google Sheets and are eager to take your data analysis skills to the next level, this course is for you! Data Analysis with Pandas and Python introduces you to the popular Pandas library built on top of the Python programming language. Pandas is a powerhouse tool that allows you to do anything and everything with colossal data sets - analyzing, organizing, sorting, filtering, pivoting, aggregating, munging, cleaning, calculating, and more!
Over the course of more than 19 hours, you will step-by-step through Pandas, from installation to visualization! You'll be covered with hundreds of different methods, attributes, features, and functionalities packed away inside this awesome library. Data Analysis with Pandas and Python is bundled with dozens of datasets for you to use. Dive right in and follow along with the lecturer's lessons to see how easy it is to get started with pandas!You will learn:
- Perform a multitude of data operations in Python's popular panda's library including grouping, pivoting, joining, and more!
- Learn hundreds of methods and attributes across numerous pandas objects
- Possess a strong understanding of manipulating 1D, 2D, and 3D data sets
- Resolve common issues in broken or incomplete data sets
This course offers:
- Flexible deadlines: Reset deadlines based on your availability.
- Get a Certificate when you complete
- 100% online
- Intermediate level
- Approximately 21.5 hours to complete
- Subtitles: English
Participants: 165,561
Enroll here: https://www.udemy.com/course/data-analysis-with-pandas/
udemy.com 
udemy.com -
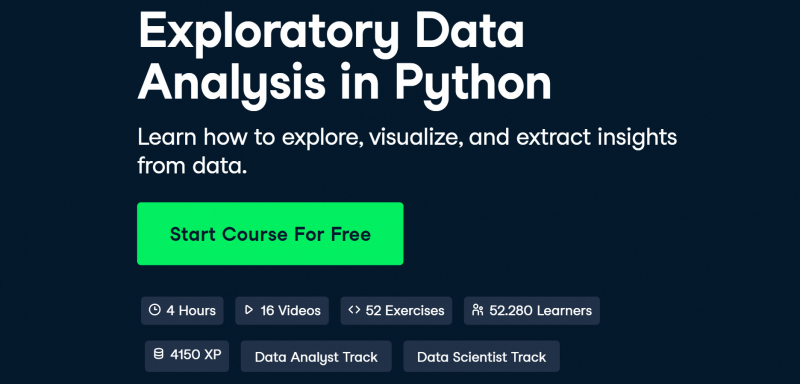
Exploratory data analysis is a process for exploring datasets, answering questions, and visualizing results. And Exploratory Data Analysis in Python in Datacamp is among the best online exploratory data analysis courses. This course presents the tools you need to clean and validate data, visualize distributions and relationships between variables, and use regression models to predict and explain.
You'll explore data related to demographics and health, including the National Survey of Family Growth and the General Social Survey. But the methods you learn apply to all areas of science, engineering, and business. You'll use Pandas, a powerful library for working with data, and other core Python libraries including NumPy and SciPy, StatsModels for regression, and Matplotlib for visualization. With these tools and skills, you will be prepared to work with real data, make discoveries, and present compelling results.
You will learn:
- Read the data, check for errors and special cases, and prepare data for analysis.
- Began exploring it by using histograms to visualize distributions
- Represent distributions using Probability Mass Functions (PMFs) and Cumulative Distribution Functions (CDFs)
- Explore relationships between variables two at a time, using scatter plots and other visualizations to extract insights from a new dataset obtained from the Behavioral Risk Factor Surveillance Survey (BRFSS)
- Explore multivariate relationships using multiple regression to describe non-linear relationships and logistic regression to explain and predict binary variables.
This course offers:
- Flexible deadlines: Reset deadlines based on your availability.
- Get a Certificate when you complete
- 100% online
- Beginner level
- Approximately 4 hours to finish
- Subtitles: English
Participants: 52,280
Enroll here: https://www.datacamp.com/courses/exploratory-data-analysis-in-python
datacamp.com 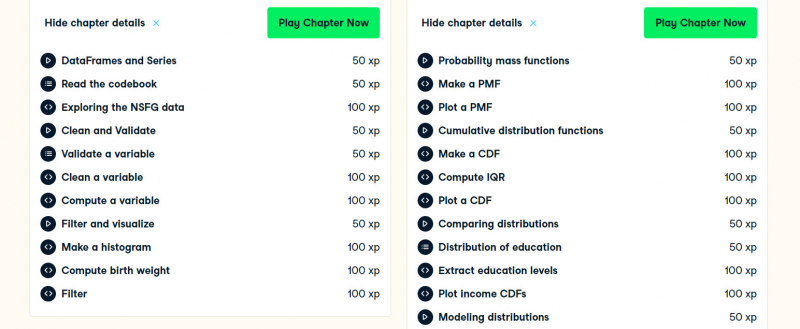
datacamp.com -
Exploratory Data Analysis with MATLAB is definitely the best online exploratory data analysis course that you should take part in. In this course, you will learn to think like a data scientist and ask questions about your data. You will use interactive features in MATLAB to extract subsets of data and compute statistics on groups of related data. You will learn to use MATLAB to automatically generate code so you can learn syntax as you explore. You will also use interactive documents, called live scripts, to capture the steps of your analysis, communicate the results, and provide interactive controls allowing others to experiment by selecting groups of data.
These skills are valuable for those who have domain knowledge and some exposure to computational tools, but no programming background is required. To be successful in this course, you should have some knowledge of basic statistics (eg, histograms, averages, standard deviation, curve fitting, interpolation).
By the end of this course, you will be able to:
- Load data into MATLAB, prepare it for analysis, visualize it, perform basic computations, and communicate your results to others.
- Combine these skills to assess damages following a severe weather event and communicate a polished recommendation based on your analysis of the data.
- Visualize the location of these events on a geographic map and create sliding controls allowing you to quickly visualize how a phenomenon changes over time.
This course offers:
- Flexible deadlines: Reset deadlines based on your availability.
- Get a Certificate when you complete
- 100% online
- Intermediate level
- Course 1 of 4 in the Practical Data Science with MATLAB Specialization
- Approx. 7 p.m. to finish
- Subtitles: Arabic, French, Portuguese (European), Chinese (Simplified), Italian, Vietnamese, German, Russian, English, Spanish
Participants: 32,465
Enroll here: https://www.coursera.org/learn/exploratory-data-analysis-matlab
coursera.org 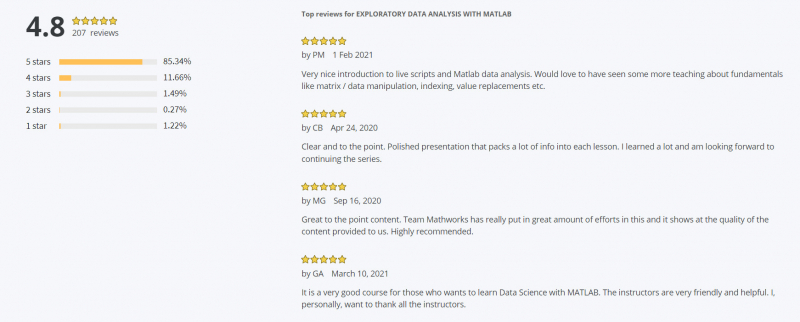
coursera.org -
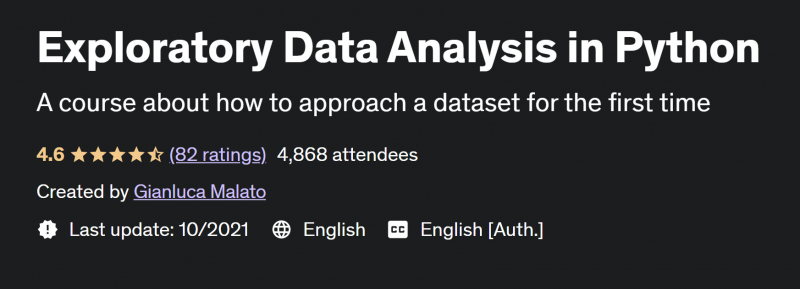
When we put our hands on a dataset for the first time, people can't wait to test several models and algorithms. This is wrong because if people don't know the information before feeding our model, the results will be unreliable and the model itself will surely fail. Moreover, if we don't select the best features in advance, the training phase becomes slow and the model won't learn anything useful. So, the first approach we must have is to take a look at the dataset and visualize the information it contains. In other words, people have to explore it. That's the purpose of the Exploratory Data Analysis.
Exploratory Data Analysis is an important step in data science and machine learning. It helps people explore the information hidden inside a dataset before applying any model or algorithm. It makes heavy use of data visualization, it's bias-free. Moreover, it lets people figure out whether our features have predictive power or not, determining if the machine learning project people are working on has the chance to be successful. Without EDA, people may give the wrong data to a model without reaching any success.
With this course, you will learn:
- How to visualize information that is hidden inside the dataset
- How to visualize the correlation and the importance of the columns of a dataset
- Some useful Python libraries
This course offers:
- Flexible deadlines: Reset deadlines based on your availability.
- Get a Certificate when you complete
- 100% online
- Beginner level
- Approximately 2 hours to complete
- Subtitles: English
Participants: 4,868
Enroll here: https://www.udemy.com/course/exploratory-data-analysis-in-python/
udemy.com 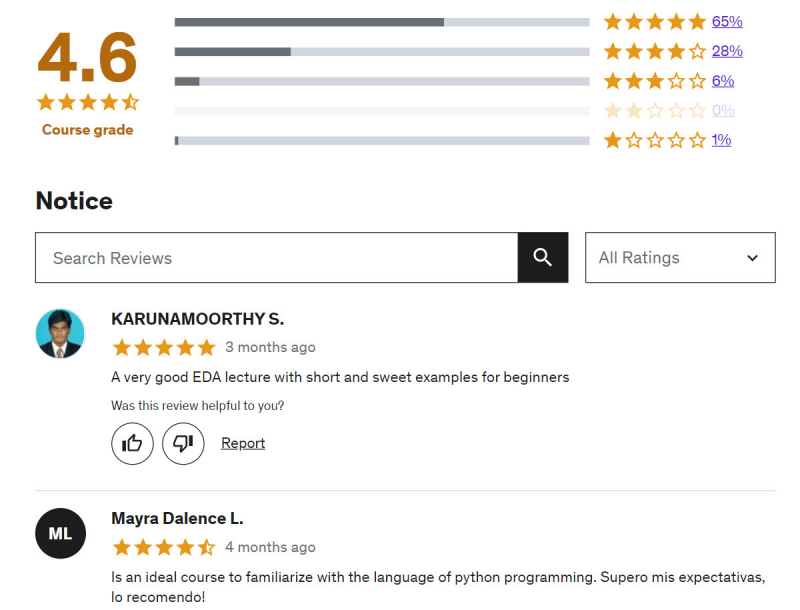
udemy.com -
Offered by the Association of Data Scientists, the Exploratory Data Analysis course is meant for learners who want to master data analytics– from the basics to the advanced level. Upon completion of this workshop, one will have an in-depth understanding of data analysis techniques and of the different analysis methods; and will acquire hands-on experience in statistical analysis of data and data visualization using Python. The full-day workshop will be addressed by Vaibhav Kumar. The prerequisites for taking this course include knowledge of Python and statistics and some familiarity with Jupyter/Colab Notebooks. This is also one of the best online exploratory data analysis courses that you should join.
Learning Outcomes:
- In-depth understanding of data analysis techniques
- Hands-on exposure to statistical analysis of data
- Complete knowledge of different analysis methods with their importance
- Hands-on experience with data visualization using Python
This course offers:
- Flexible deadlines: Reset deadlines based on your availability.
- Get a Certificate when you complete
- 100% online
- Intermediate level
- Approximately 2 hours to complete
- Subtitles: English
Participants: 2,269
Enroll here: https://www.adasci.org/continuous-learning/mastering-exploratory-data-analysis-16910993
adasci.org 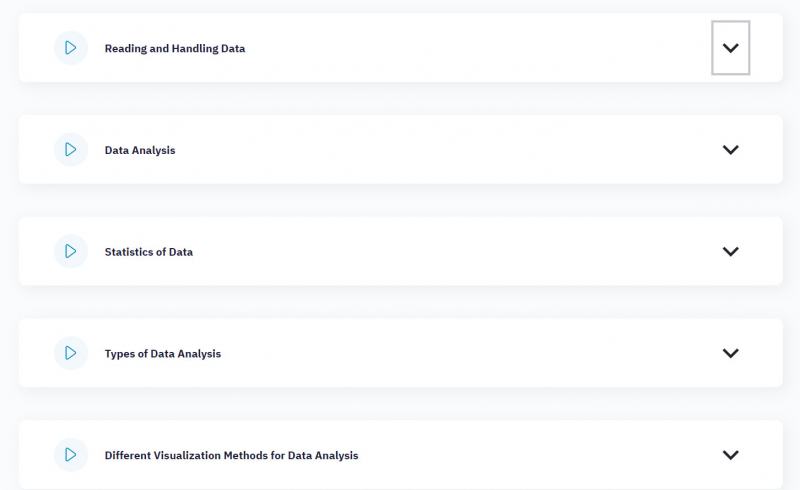
Syllabus of the course (adasci.org) -
Exploratory data analysis is an important part of any Data Scientist or Analyst’s workflow, so if you are interested in working with data, the Exploratory Data Analysis in Python course is for you. This is one of the best online exploratory data analysis courses. In this course, you will learn about exploratory data analysis techniques in Python, including EDA for data preparation, Summary statistics, Data visualization techniques, EDA prior to building a machine learning model, Prior to taking this course, you should have some knowledge of base Python and experience with pandas DataFrames.
In the Exploratory Data Analysis in Python course, you will learn about exploratory data analysis and what it is used for. Then, you will learn how to use exploratory data analysis (EDA) to inform data inspection, cleaning, and validation and learn how to use exploratory data analysis (EDA) to inform data inspection, cleaning, and validation. Next, you will be taught how to use aggregate functions in pandas to calculate tables of summary statistics. Last, the lecturer will be teaching you to learn how to investigate whether there is an association between two variables.
This course offers:
- Flexible deadlines: Reset deadlines based on your availability.
- Get a Certificate upon completion
- 100% online
- Beginner level
- Approximately 10 hours to finish
- Subtitles: English
Participants: 924
Enroll here: https://www.codecademy.com/learn/eda-exploratory-data-analysis-python
codecademy.com 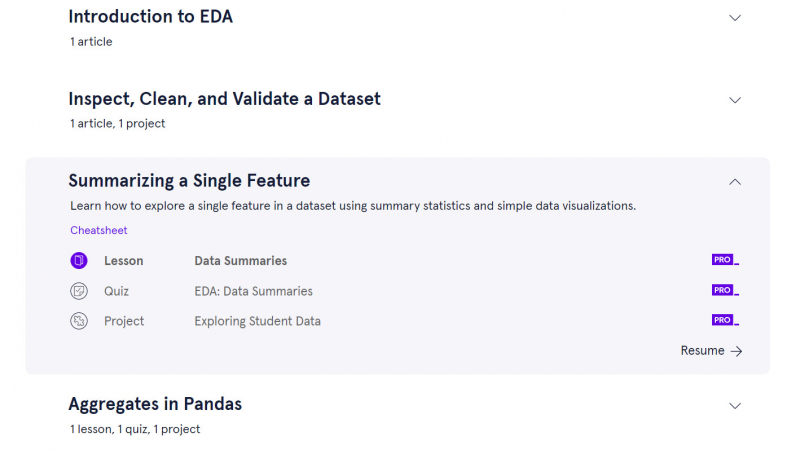
Syllabus of the course (codecademy.com) -
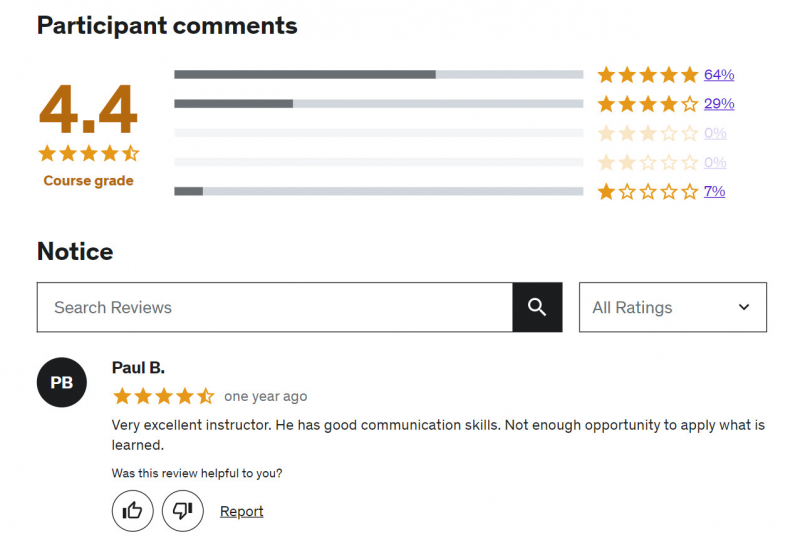
Another best online exploratory data analysis course is Understanding New Data - Exploratory Analysis in R. The curriculum is divided into three main sections. Although this course doesn't have a focus on the basic concepts of statistics, some of the most important concepts are covered in the first section of the course. The two other sections have their focus on the initial and the exploratory data analysis phases respectively. Initial data analysis (or IDA for short) is where clean and shape the data into a form suitable for the planned methods. This is also where make sure the data makes sense from a statistical point of view. The IDA section present tools and methods that will help you figure out if the data was collected properly and if it is worthy of being analyzed.
On the other hand, the exploratory data analysis (EDA) section offers techniques to find out if the data can answer your analytical questions, or in other words, if the data has a relevant story to tell. This will spare you from investing time and effort into a project that will not deliver the results you hoped for. In an ideal case, the results of EDA may confirm that the planned analysis is worth it and that there are insights to be gained from that dataset and project. If you are interested in statistical methods and R tools that help you bridge the gap between data collection and confirmatory data analysis (CDA), then this program is for you. Take a look at the curriculum and give this course a try!
This course offers:
- Flexible deadlines: Reset deadlines based on your availability.
- Get a Certificate when you complete
- 100% online
- Beginner level
- Approximately 7 hours to complete
- Subtitles: English
Participants: 165
Enroll here: https://www.udemy.com/course/exploratory-analysis-in-r-data-analysis/