Information Visualization Specialization by NYU (Coursera)
With the aim of providing students with the knowledge and practical skills needed to develop a solid foundation in information visualization as well as to design and develop advanced applications for visual data analysis, New York University is providing this information visualization program via Coursera. It is comparable to the graduate Information Visualization course offered by the Tandon School of Engineering at New York University.
This specialization comprises of four courses—foundations, applied perception, programming with D3.js, and advanced visualization techniques—and does not require any prior expertise. The following topics are covered in these courses:
- Overview of what visualization is and its scope and goals
- Recognizing type of information in data so that you can find appropriate visual representations
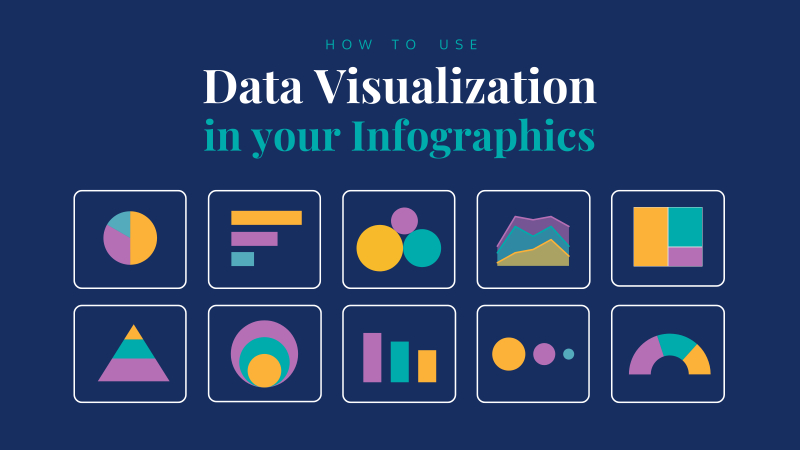
- Fundamental graphs such as bar charts, line charts and scatter plots
- Concept of visual encoding and decoding
- Fundamental concepts of visual perception applied to visualization design
- How to use D3.js to create powerful visualizations for web
- How to create choropleth and symbol maps, node-link diagrams and tree maps
- How to link two or more views through interaction
- How to visualize specific kinds of data (beyond tabular)
- Geographical, temporal and network visualization
- How to create highly interactive multiple-view visualizations
Exercises and practice assignments are part of every course. For some assignments, students must plan and create a comprehensive interactive display using sets of real-world data. Three interviews are also featured, giving students the chance to learn from the first-hand accounts of practitioners and researchers.
Key Highlights:
- Opportunity to take a university level graduate course in visualization
- Provides a strong understanding of visual perception and visual encoding to enable learners to design and evaluate innovative visualization methods on their own
- Develop advanced web-based applications for visual data analysis
- Learn what designs are available for a given problem and what are their respective advantages and disadvantages
- Interviews with great researchers and practitioners in the field
- Hands-on projects that enable students to demonstrate mastery of the subject
Duration: 4 months, 3 hours per week
Rating: 4.7
Link: https://www.coursera.org/specializations/information-visualization


