Top 8 Best Data Visualization Websites

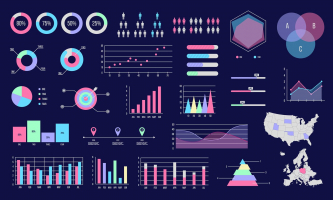
Data visualization is an essential part of data analysis, allowing complex data sets to be presented in an easily digestible manner. If you're looking for data ... read more...visualization websites that take the heavy lifting out of understanding and interpreting data, look no further. Here's a list of the best data visualization websites that offer powerful tools and resources to make sense of a wide range of data.
-
Looker Studio is a powerful tool that allows you to transform your data into visually appealing and customizable dashboards and reports. With its user-friendly drag and drop report editor, you can quickly convey your data narrative using a range of charts, such as line, bar, pie, and geo maps. You can even include interactive elements like viewer filters and date range controls to make your reports dynamic.
One of the key features of Looker Studio is its ability to connect to various data sources without the need for programming. Whether you're working with databases like BigQuery, MySQL, and PostgreSQL, Google Marketing Platform products such as Google Ads and Analytics, or social media platforms like Facebook and Twitter, Looker Studio has got you covered. It even allows you to blend data from different sources for a comprehensive analysis.
Sharing and collaborating on your insights is effortless with Looker Studio. You can invite others to view or edit your reports, send them scheduled email updates, or embed your reports in other pages such as Google Sites or blog posts. Real-time collaboration is also supported, enabling you to work together with your team on the same Looker Studio file. For organizations, Looker Studio offers enterprise features that allow administrators to manage users and control access to assets through Cloud Identity and Google Workspace integration.
Website: https://lookerstudio.google.com/

Photo by Towfiqu barbhuiya on Unsplash (https://unsplash.com/photos/Q69veNk1iJQ) Looker Studio -
Tableau is a revolutionary visual analytics platform that is reshaping the way we leverage data to solve problems, empowering individuals and organizations to maximize the value of their data. Tableau provides an analytics platform that simplifies data exploration and management, enabling faster discovery and sharing of insights that have the potential to drive significant changes in businesses and the world.
Tableau's mission is the commitment to helping people visualize and comprehend data. The user-centric approach is evident across their range of products, catering to analysts, data scientists, students, teachers, executives, and business users alike. From seamless data connectivity to collaborative capabilities, Tableau offers an end-to-end analytics platform that excels in power, security, and flexibility.
Tableau originated from a computer science project at Stanford in 2003, aiming to enhance data analysis flow and improve data accessibility through visualization. By introducing intuitive and visually appealing analytics tools, Tableau disrupted the business intelligence landscape, making data analysis accessible to everyone. Data has boundless potential to drive transformation, but it requires empowered individuals to unlock its value. The Tableau community, consisting of over one million active members, is a vibrant ecosystem of diverse individuals who inspire and support one another through forums, user groups, and events like the renowned Tableau Conference.
Website: https://www.tableau.com/
Tableau Tableau -
Infogram is an intuitive visualization tool that empowers individuals and teams to effortlessly create captivating infographics, reports, slides, dashboards, maps, and social media visuals. With Infogram, you can save time and maintain a consistent brand image. Starting with Infogram's collection of designer templates ensures that you never have to face a blank screen again. These ready-to-use templates are not only visually engaging but also leave a lasting impression on your audience, giving your content a polished and professional look.
Infogram goes beyond static content and allows you to wow your audience with interactive elements. With object animations, you can take your stories to the next level. Set objects to zoom, bounce, flip, fade, and slide effortlessly, adding a touch of dynamism to your work. Moreover, Infogram offers enhanced interactivity with interactive charts and maps. Utilize features like tooltips, tabs, clickable legends, and links to create engaging and interactive visual experiences.
Collaboration becomes seamless with Infogram. It serves as the perfect platform for your team to visualize data in real-time. You can create, edit, and publish projects directly from your team library, fostering endless possibilities for collaboration. Also, Infogram's powerful analytics feature enables you to track how your work resonates with your audience. Gain valuable insights into detailed viewer demographics, average on-screen rates, and the number of people who shared your content.
Website: https://infogram.com/

Photo by Towfiqu barbhuiya on Unsplash (https://unsplash.com/photos/nApaSgkzaxg) Infogram -
Flourish is an innovative tool that revolutionizes interactive data visualization and animated data storytelling. With its wide range of user-friendly templates, Flourish empowers users to effortlessly create stunning charts, detailed maps, and engaging interactive stories. Designed specifically for non-coders, Flourish eliminates the need for costly and time-consuming custom projects. Since its launch in 2018, thousands of organizations have embraced Flourish as their go-to tool for communicating with millions of viewers daily. Whether you want to create agency-quality data graphics or animated stories, Flourish brings your data to life and captivates your audience.
The versatility of Flourish extends to embedding, sharing, and presenting your creations. You can seamlessly embed your visualizations into various platforms, create captivating presentations, or generate engaging content for social media. With Flourish, maintaining brand consistency is effortless. You can customize themes to match your brand identity, incorporating your logo, fonts, colors, and styles. This ensures that every visualization and story you create reflects your brand's unique identity.
Flourish empowers you to transform your data into captivating visual experiences. Whether you need to engage your audience, empower your team, embed visualizations, or maintain brand consistency, Flourish provides the tools and flexibility to bring your data to life in a visually stunning and interactive way.
Website: https://flourish.studio/
Flourish Flourish -
Datawrapper is an exceptional data visualization tool designed to enhance the storytelling experience by creating compelling charts and maps. With Datawrapper, you can enrich your stories by incorporating interactive charts, maps, and tables. Renowned teams worldwide rely on Datawrapper to effectively convey their messages through data.
No coding or design skills are necessary to utilize Datawrapper's capabilities. Whether you're a beginner or an expert, you can easily create an unlimited number of visualizations, even with the free plan. Nonetheless, by providing your style guide, you can have a bespoke chart theme tailored to your brand, guaranteeing a 100% white-labeled appearance.
Datawrapper simplifies the updating process by allowing visualizations to automatically refresh. By linking external CSV files or Google Sheets, your charts and maps can stay up to date effortlessly. Not only can Datawrapper generate captivating online visuals, but it also enables the creation of print-ready graphics, including PDFs with defined CMYK colors. Various formats such as PNG, SVG, or PDF are provided to save your work, enabling further editing possibilities in applications like Adobe Illustrator.
Furthermore, collaboration is made easy with Datawrapper's team-oriented features. You can take advantage of shared folders, integration with popular communication platforms like Slack and Teams, and administrative permissions to keep track of your team's creative endeavors.
Website: https://www.datawrapper.de/

Photo by Jason Briscoe on Unsplash (https://unsplash.com/photos/amLfrL8LGls) 
Photo by Austin Distel on Unsplash (https://unsplash.com/photos/jpHw8ndwJ_Q) -
RAWGraphs is a remarkable free and open-source data visualization tool designed to simplify the visual representation of complex data for users of all levels. With its user-friendly interface, RAWGraphs acts as a bridge between spreadsheet applications like Microsoft Excel and vector graphics editors such as Adobe Illustrator. Also, it aims to empower designers and visualization enthusiasts by providing them with an accessible platform to create stunning visuals.
One of the key strengths of RAWGraphs is its open-source nature, built on top of existing open-source projects. This enables continuous community contributions and improvements, making it a collaborative tool for the data visualization community. RAWGraphs also offers a diverse range of nearly 30 visual models that cater to different data types and structures. Whether you need to showcase quantities, hierarchies, or time series, RAWGraphs has the right chart to help you find insights and communicate your data effectively.
Data security is a top priority with RAWGraphs. Although it operates as a web app, all the data you input remains confidential and is processed exclusively within your web browser. RAWGraphs also provides flexibility in exporting your projects. You will have the option to save your work or export it as a vector or raster image. This allows you to further refine and edit your visualizations using your preferred software.
Website: https://www.rawgraphs.io/

Photo by Kaleidico on Unsplash (https://unsplash.com/photos/3V8xo5Gbusk) RAWGraphs -
Since 1996, InetSoft has established itself as a leading innovator in the field of transforming data into actionable intelligence. Leveraging award-winning technology based on open standards, InetSoft empowers users to gain valuable insights from data in the era of cloud computing and Software-as-a-Service (SaaS).
InetSoft's analytics and reporting solutions are purpose-built for cloud computing and SaaS environments, where software and data are increasingly spread across several applications. The combined solution provided by InetSoft seamlessly integrates analytics and reporting, recognizing their distinct characteristics. Users can benefit from flexible data and visual dashboards for analytics, while the reporting component facilitates the presentation of voluminous details through paginated content.
InetSoft's product lineup consists of three offerings: Style Scope, Style Report, and Style Intelligence. These products cater to different usage models while utilizing the same powerful analytic engine and Big Data platform. Style Scope focuses on visualization dashboards, analytics, and real-time monitoring, while Style Report enables the creation of pixel-perfect reports, ad-hoc reporting, and scheduled delivery. Style Intelligence provides comprehensive data intelligence for dashboards, reporting, and machine learning. As a result, InetSoft's versatile solutions have found success across numerous industries, business functions, and departments as they offer a broad range of data connection capabilities.
Website: https://www.inetsoft.com/

Photo by Tyler Franta on Unsplash (https://unsplash.com/photos/iusJ25iYu1c) InetSoft -
ChartBlocks is a powerful tool that enables you to transform your data into stunning visualizations without requiring any coding skills. With ChartBlocks, you can effortlessly import, create, and share data visualizations that effectively communicate the story behind your data. Whether your data is stored in spreadsheets, databases, or typed directly, ChartBlocks provides seamless integration to import your data. This flexibility allows you to work with data from various sources, making it convenient to visualize your information.
ChartBlocks puts you in control of every aspect of your charts. With a wide range of graph types and extensive customization options, you can optimize your data and choose the best visualization format to represent it accurately. From line graphs to bar charts and colors to fonts, you can tailor your charts to meet your specific needs.
Moreover, sharing your insights is made easy with ChartBlocks. You can embed your charts into any website, import them into the Ceros Studio for further design enhancements, or use ChartBlocks' built-in social media sharing tools to reach a broader audience. This flexibility ensures that others can easily share and access your visualizations.
Furthermore, ChartBlocks allows you to export your charts as editable vector graphics, which are ideal for presentations or further editing, or you can optimize them for high-quality printed documents.
Website: https://www.chartblocks.io/

Photo by Jonathan Francisca on Unsplash (https://unsplash.com/photos/Q-y8EsExqYA) 
Photo by Kevin Bhagat on Unsplash (https://unsplash.com/photos/zNRITe8NPqY)