Data Visualizations with Python using Matplotlib

Data Visualizations with Python using Matplotlib ranks 4th in the list of the best online matplotlib courses. Python is a fabulous programming language that offers us many advantages when it comes to using it as a Data Viz tool. Nowadays, it is increasingly required that professionals acquire a significant level in terms of data visualizations, for the creation of graphs, dashboards, reports, that help a business to make better decisions with its data.
It is important to mention that this guided project has an "intermediate" difficulty for its development. The main objective at the end of all the knowledge capsules and associated practice deliveries is that students can learn the most relevant and important concepts to create data visualizations in Python, using the 3 most used libraries: Matplotlib, Seaborn and Plotly. You will also see how is the library installation process using the Anaconda Prompt. With the knowledge gained in this guided project, students will be able to create their own data visualizations, efficiently, effectively, and visually appealing to their audience.
What you will learn:
- Data Import and EDA
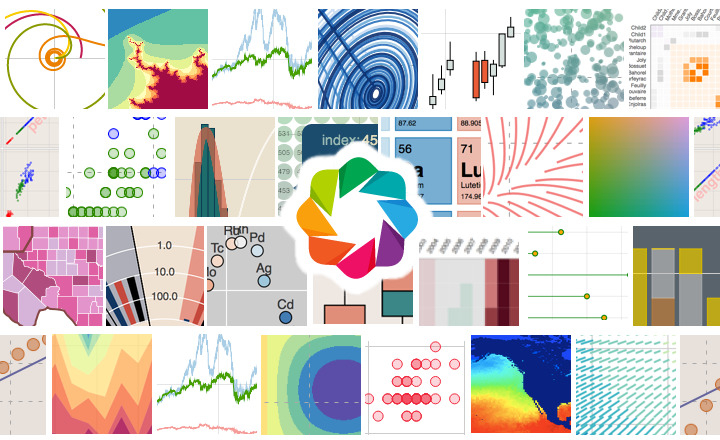
- Creating a Scatterplot chart
- Practice Activity: Customizing a Scatterplot
- Creating a Distplot Plot
- Practice Activity: Customizing a Distplot
- Creating a Barplot and Boxplot Chart
- Customizing a Boxplot and Violinplot
- Creating a Scatterplot with Plotly
- Capstone: Creating a Pie-Plot and Boxplot with Plotly
Coursera Rating: n/a
Enroll here: coursera.org/projects/visualizaciones-de-datos-con-python