Select Topics in Python: Matplotlib

Without installing anything, you can code and run your first Python script with Matplotlib in minutes! This course is intended for students who have some Python experience and offers a crash course in Matplotlib. This allows students to delve into fundamental data visualization topics that can be transferred to other languages. This course will teach you how to use Jupyter to generate and select the best graphs to represent your data.
This course is video-free to allow for a truly hands-on, self-paced learning experience. Assignments include short explanations with images as well as runnable code examples with suggested edits to further explore code examples and gain a deeper understanding by doing. Along the way, you'll receive immediate feedback from a variety of assessment items, gradually progressing from quick understanding checks (multiple choice, fill in the blank, and un-scrambling code blocks) to small, approachable coding exercises that take minutes rather than hours.
What you will learn:
- Jupyter notebooks
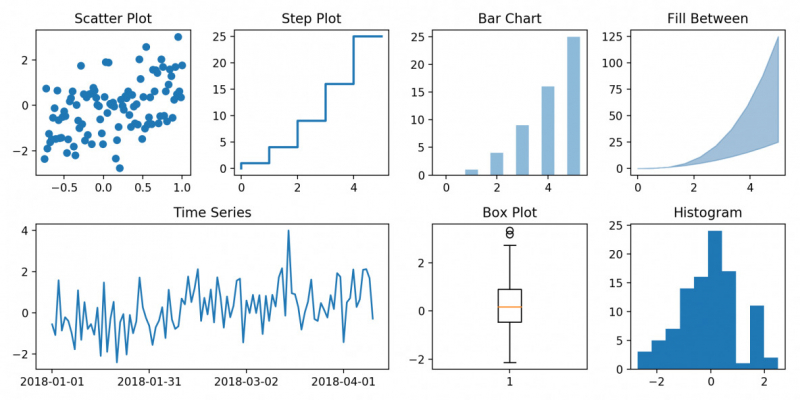
- Create charts and plots
- Style and customize charts and plots
Enroll here: es.coursera.org/learn/select-topics-in-python-matplotlib


