Learning Python for Data Analysis and Visualization (Udemy)

The course has over 21 hours of video content in 100+ lectures, sample python code notebooks, extra articles and reading materials, and various data analysis projects that learners can utilize for their portfolio. The course walks students through many Python data analysis libraries:
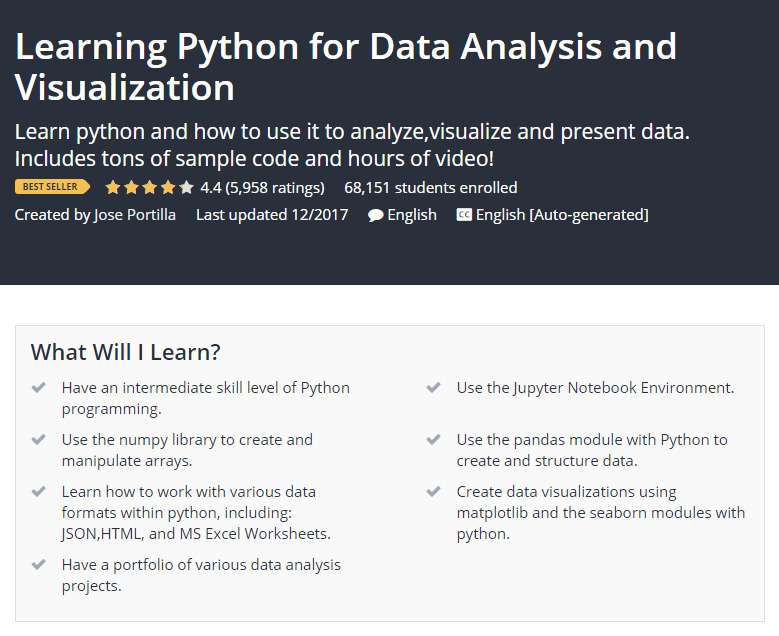
Jose Portilla designed this course, which is available on Udemy. The purpose of this course is to give students a thorough understanding of Python and how it can be used to successfully analyze and visualize data. This course will teach you NumPy, pandas, how to import and export data in Python, how to visualize data with Python tools, and how to create a data portfolio. It also mentions machine learning and Scikit-Learn. In addition to all of this, it includes appendix materials such as statistics, SQL with Python, and web scraping with Python. Students also learn to use SciPyto create distributions and solve statistical problems.
- NumPy – how to use Numpy to create and manipulate arrays with Python
- Pandas – how to use Pandas to create series, dataframes and do quick and effective analysis on data. Also covers Pandas built-in visualization tools
It also demonstrates how to create different visualizations for a wide range of data sets using following Python libraries:
- Matplotlib
- Seaborn
Key Highlights
- Excellent fit for learning how to program in Python and create Data Visualization with Python libraries
- Learn Data Analysis by Numpy and Pandas
- Learn how to use Python and Pandas to work with data in a variety of formats like JSON, HTML, text, csv and even Excel files
- Learn to create modern, impressive data visualizations using Matplotlib and Seaborn modules with python
- Learn to create a variety of charts, Bar charts, Line charts, Stacked charts, Pie charts, Histograms, KDE plots, Violin plots, Box plots, Regression plots, Scatter Plots, and Heatmaps
- Get access to over 100 example python code notebooks
- Build a portfolio of various data analysis projects
Duration : 21 hours on-demand video
Udemy Rating : 4.3/5.0
Enroll here: udemy.com/course/learning-python-for-data-analysis-and-visualization/