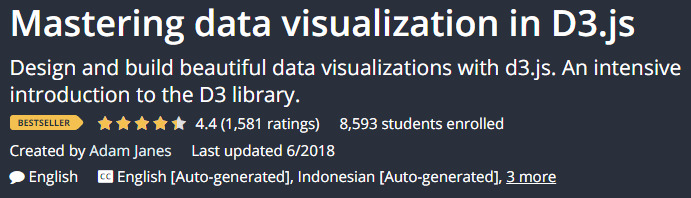
Mastering Data Visualization in D3.js (Udemy)

Mastering Data Visualization in D3.js is one of the best online Data Visualization Courses. D3.js is a JavaScript data visualization toolkit that may be used to create visually appealing charts, maps, flows, live and interactive graphs, and other data-driven representations. Adam Janes' Udemy Data Visualization course provides a thorough introduction to the D3.js toolkit and how to use it to design and build amazing data visualizations. It takes learners from complete D3 newcomers to being able to create any visualization they can think of. It not only teaches students how to build typical charts and graphs, but it also gives them the tools they need to construct any visualization on their own. This Data Visualization with D3.js course is structured into three parts:
- Part 1: Fundamentals of D3 – It covers the fundamentals of how D3 works. Learners are introduced to SVGs, data joins, scales and axes and how to create interactive visualizations by adding events to the page.
- Part 2: Visualization walkthroughs – It introduces learners to many types of visualizations and walks them through example code line-by-line.
- Part 3: Complex linked views – It teaches learners to create unified web apps where many visualizations on the page communicate with each other at the same time.
This is a hands-on course with four class projects (a bar chart, an updating bubble chart, an interactive line chart, and a data dashboard) that allow students to consolidate their knowledge and practice their skills with real-world data sets. This Data Visualization class is designed for students who have some web programming experience and want to learn about data visualization design and building complex interactive websites with D3js.
Key Highlights
- Best online course for Data Visualization in D3.js
- Understand the fundamental building blocks of D3
- Understand fundamental principles for design that help you to come up with unique visualizations of your own and articulate your design decisions to others
- Learn to choose the right visual channels for the data you’re working with to create unique visualizations
- Master advanced tools in D3, building choropleth maps, brushes, tooltips, and layouts
- Critique existing visualizations and invent better designs for displaying data
Duration : 7 hours on-demand video
Udemy Rating : 4.5/5.0
Enroll here: udemy.com/course/masteringd3js/