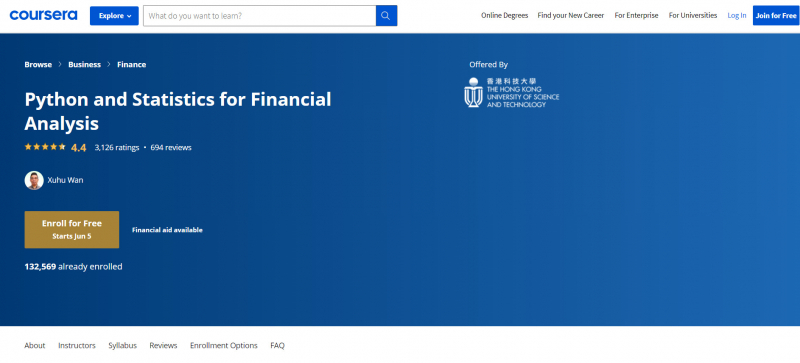
Python & Statistics for Financial Analysis by Hong Kong University (Coursera)

Python is not only the most popular programming language in Data Science, but it is also gaining traction in the financial sector. The Hong Kong University of Science and Technology has established a course that combines Python coding with statistical ideas and applies them to Financial Analysis, such as stock data analysis. After learning the fundamentals of statistics, students are taught how to apply those concepts to financial analysis using Python packages and syntaxes. This is one of the best online financial analysis courses.
Students learn how to import, pre-process, and store financial data at the start of the course, as well as how to change current data by creating new variables utilizing multiple columns. Later modules teach students how to use regression models to predict stock returns. Finally, students learn how to assess a model's performance using statistical and financial standards like the Sharpe Ratio and Maximum Drawdown.
Students should have a basic understanding of python and probability before enrolling in this intermediate-level financial analysis course. On the course platform, a Jupyter Notebook environment has been put up to allow students to practice python coding and financial analysis topics covered in the course. Client programs are not required to be installed.
The course is designed for anyone interested in using Python to perform financial analysis. Students will be able to write their own python code to build statistical models to aid in financial analysis by the end of the course.
Key Highlights
- Learn how to use pandas to import, pre-process, save, and visualize financial data. Dataframe
- Learn how to apply key statistical ideas to financial situations (random variable, frequency, distribution, population and sample, confidence interval, linear regression, and so on).
- Using a multivariate linear regression model, create a trading model.
- Learn how to assure the correctness and performance of your financial models utilizing various investment indicators as a technique of evaluation.
This course offers:
- Flexible deadlines: Reset deadlines in accordance to your schedule.
- Shareable Certificate: Earn a Certificate upon completion
- 100% online: Start instantly and learn at your own schedule.
- Intermediate Level: You will get the most out of the course if you have basic knowledge in probability.
- Approx. 13 hours to complete
- Subtitles: Arabic, French, Portuguese (European), Italian, Vietnamese, German, Russian, English, Spanish, Japanese
Duration: 4 weeks, 3-4 hours per week
Rating: 4.4/5
Link: https://www.coursera.org/learn/python-statistics-financial-analysis