Top 10 Best Online Financial Analysis Courses

The most sought-after job in the financial services business is that of a financial analyst. Financial statement analysis gives practical information about a ... read more...company's financial health and long-term growth potential. The demand for financial analysts expands in lockstep with overall economic activity. If you are ready to dive into this lucrative and rapidly expanding field, you can get started right away by taking one of the Best Online Financial Analysis Courses that Toplist has compiled for you!
-
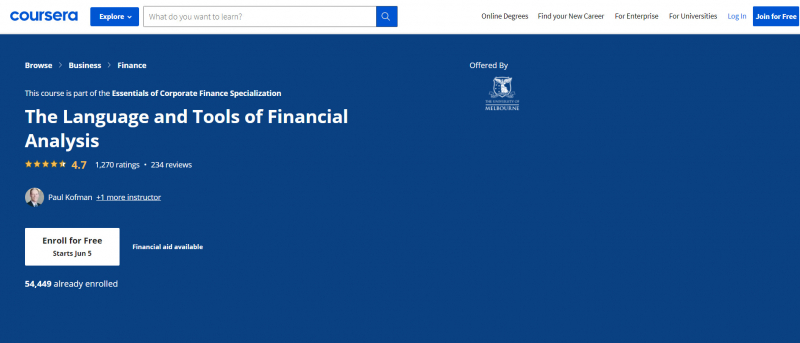
The first online course Toplist would like to introduce to you in this list of the best online financial analysis courses is Language & Tools of Financial Analysis. This course is the first of four that make up the Essentials of Corporate Financial Analysis and Decision-Making Specialization. This program was created from the ground up by the respected University of Melbourne in collaboration with their finance colleagues at Bank of New York Mellon (BNY Mellon), one of the world's most successful financial companies.
This course provides students with a solid foundation in financial analysis principles. It reveals the key accounting data that underpins financial analysis and demonstrates how to use that data in financial analysis using discounted cash flow methods to arrive at a fair firm valuation. The classes are grounded on finance practice, so you'll get not just academic but also practical knowledge of corporate tool sets that will assist you in making well-informed company decisions.
Paul Kofman (Ph.D. Erasmus University Rotterdam), Dean of the Faculty of Business and Economics at the University of Melbourne, and Sean Pinder (Ph.D.), Associate Professor of the University of Melbourne's Department of Finance, are teaching the course. It is divided into four modules, each of which includes video lectures, extra reading material, and several quizzes and exercises.
Key Highlights
- Learn the fundamentals of accounting principles and financial analysis, as well as the connections between them.
- Learn how to assess the firm's value creation.
- With real-world examples, learn how to decipher a company's essential financial statements and how they are reported to its shareholders.
- Learn how financial analysts utilize ratio analysis to assess a company's relative profitability, leverage, efficiency, and liquidity.
- Actual financial statements from Kellogg's and its competitor Kraft, both of which are publicly traded in the United States, are utilized in the course to show financial analysis methodologies.
- Learn how to assess financial decisions using the discounted cash flow (DCF) analysis technique.
- The course can be audited for free. By completing the course tasks and paying a modest cost, you can earn a Verified Certificate.
This course offers:
- Flexible deadlines: Reset deadlines in accordance to your schedule.
- Shareable Certificate: Earn a Certificate upon completion
- 100% online: Start instantly and learn at your own schedule.
- Course 1 of 5 in the: Essentials of Corporate Finance Specialization
- Approx. 11 hours to complete
- Subtitles: Arabic, French, Portuguese (European), Italian, Vietnamese, German, Russian, English, Spanish
Duration: 14 hours, 4 to 6 hours per week
Rating: 4.7/5Link: https://www.coursera.org/learn/financial-analysis
coursera.org 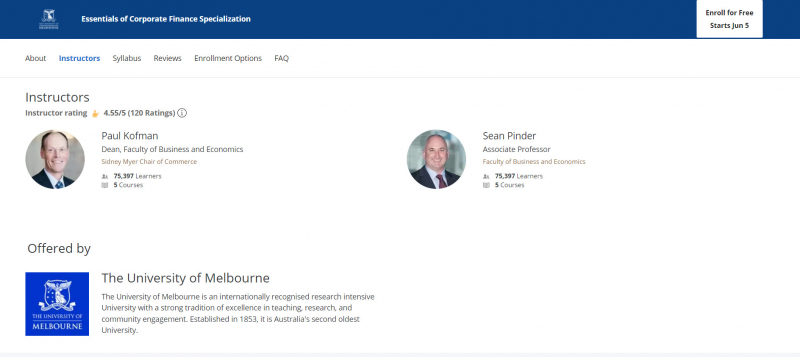
coursera.org -
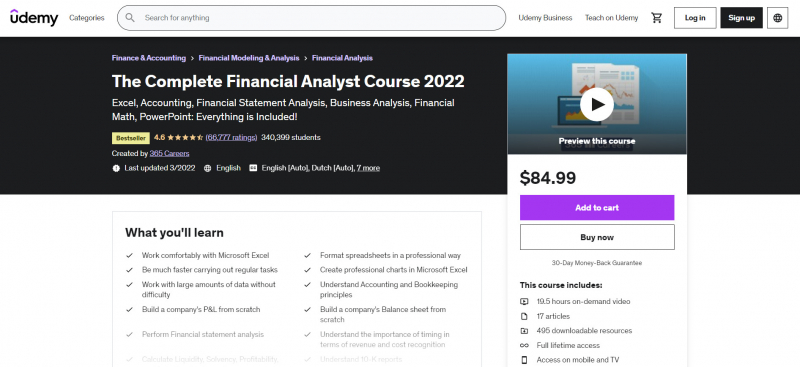
With over 200,000 students enrolled, this is perhaps the top Financial Analyst course on Udemy. It is the most comprehensive, dynamic, and practical education available on the internet, covering a wide range of topics such as financial arithmetic, business analysis, financial statement analysis and valuation, capital budgeting, and accounting. Students also learn how to use the necessary tools for financial analysis, such as Microsoft Excel and PowerPoint.
This course is offered by 365 Careers, the most popular business course provider on Udemy. More than 500000 students and staff from 80 Fortune 100 firms have enrolled in Udemy's Finance and Business courses thus far. They've trained leading companies including Citibank, PayPal, and Apple.
A series of animated videos are used to communicate the course information. There are graded quizzes, practice exercises, as well as a substantial amount of course notes, and downloadable reference material. To reinforce what has been learned, there are numerous case studies provided. Students also have access to a Q&A forum for the course, where they can ask questions and get answers to their problems.
This Udemy financial analysis course is appropriate for people of all skill levels and requires no prior knowledge. Everything begins with the fundamentals and moves to more advanced topics. Keep reading to discover more best online financial analysis courses.Key Highlights
- Working with Microsoft Excel is a breeze.
- Spreadsheets should be formatted in a professional manner.
- Be significantly more efficient when performing routine activities
- In Microsoft Excel, make professional charts.
- Working with enormous amounts of data is not a problem.
- Understand the fundamentals of accounting and bookkeeping.
- Create a company's P&L from the ground up.
- Create a balance sheet for a business from the ground up.
- Analyze the financial statements
- Recognize the significance of timing when it comes to revenue and cost recognition.
This course offers:
- 19.5 hours on-demand video
- 17 articles
- 495 downloadable resources
- Full lifetime access
- Access on mobile and TV
- Certificate of completion
Duration: 17.5 hours of on-demand video
Rating: 4.6/5
Link: https://www.udemy.com/course/the-complete-financial-analyst-course/
udemy.com 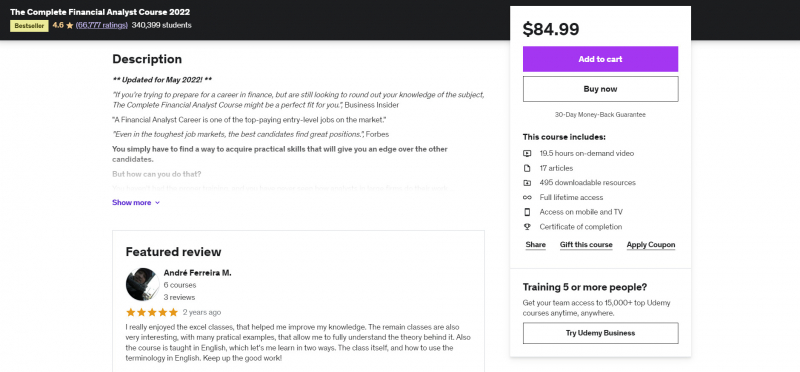
udemy.com -
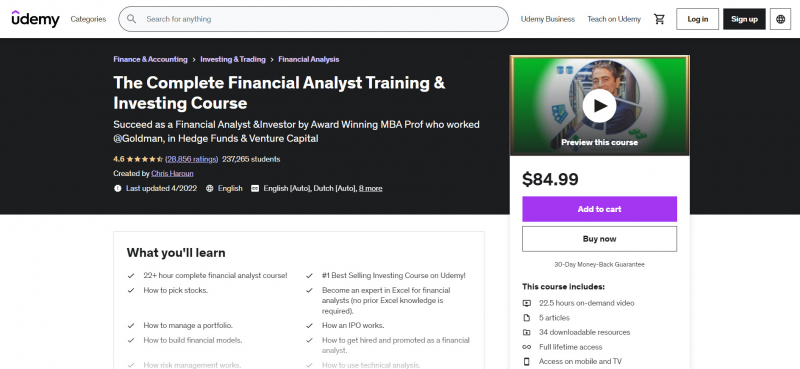
On Udemy, this is one of the most popular Financial Analyst courses. Chris Haroun, an award-winning business school professor, developed it. Chris is a former Goldman Sachs employee, hedge fund creator, venture capitalist, TEDx Talk speaker, author, and entrepreneur who has been featured in Forbes, Business Insider, Wired, and Venture Beat. He's also the #1 best-selling business teacher on Udemy, with a number of top-rated courses. Chris assures that this is the most comprehensive and best online financial analyst course available, as it is based on his own real-world experience.
This financial analyst certification is a comprehensive course that teaches students all they need to know about finance and investment, including how to buy stocks, perform financial statement analysis, value firms, apply technical analysis, and develop financial models, among other things. It explains how to succeed in 14 distinct financial analyst professions, as well as how to find out which one is right for them and how to get employed and promoted in the field. Students are also taught Excel abilities so that they can create their own financial statements and company valuations. There are various informative and interactive case studies available, such as how an IPO works, risk management, and portfolio management.
This course is for anyone who wants to learn how to be a better financial analyst, investor, stock picker, or portfolio manager. This training does not require any prior experience. The course includes 225 video lectures with a total duration of more than 22 hours, as well as four articles and 34 downloadable resources.Key Highlights
- Learn about the 14 various types of financial analyst careers and how they relate to one another (including
- Investment Banking, Venture Capital, Private Equity, Equity Sales, Equity Capital Markets, Private Wealth Management, Mutual Fund, etc.)
- For financial analysts, become an Excel specialist.
- Learn the basics of risk management.
- Learn how to read and analyze an income statement.
- To assist you in creating financial statements from scratch, use and construct Excel-based templates (meaning income statements, balance sheets, cash flow statements, and more)
- Use and develop Excel-based templates to assist you in valuing companies using a variety of valuation approaches such as P/E, P/R, and Discounted Cash Flow (DCF)
- Learn how interest rates are modified and why it's important for successful financial analysts to grasp them.
- What are the Functions of Monetary and Fiscal Policy?
- To develop a financial model, you'll need to know where to gather data.
- To construct financial models, you must first understand and use modeling best practices.
- To add to your résumé, earn a certificate of completion.
This course offers:
- 22.5 hours on-demand video
- 5 articles
- 34 downloadable resources
- Full lifetime access
- Access on mobile and TV
- Certificate of completion
Duration: 22.5 hours on-demand video
Rating: 4.6/5
Link: https://www.udemy.com/course/the-complete-financial-analyst-training-and-investing-course/
udemy.com 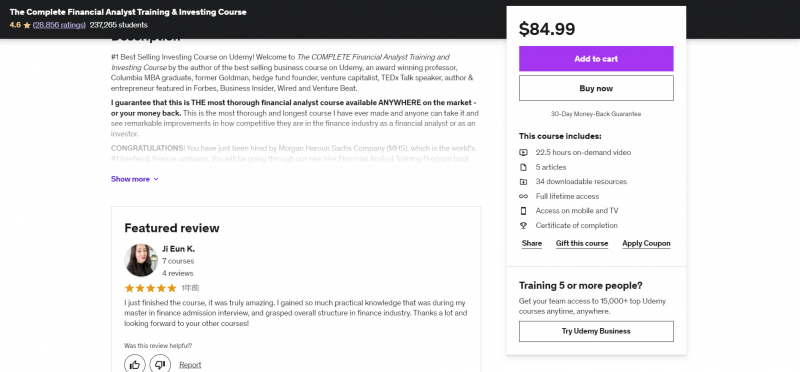
udemy.com -
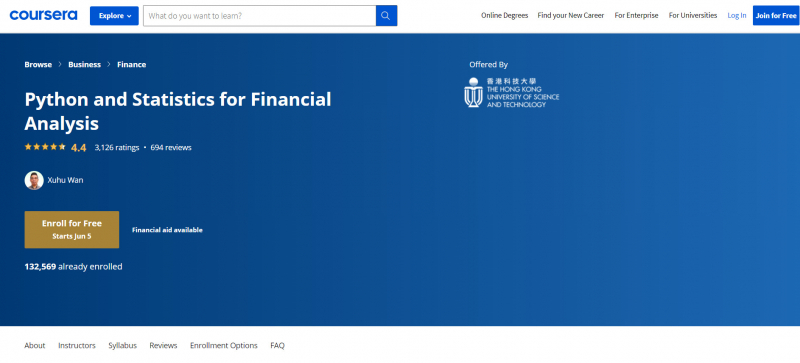
Python is not only the most popular programming language in Data Science, but it is also gaining traction in the financial sector. The Hong Kong University of Science and Technology has established a course that combines Python coding with statistical ideas and applies them to Financial Analysis, such as stock data analysis. After learning the fundamentals of statistics, students are taught how to apply those concepts to financial analysis using Python packages and syntaxes. This is one of the best online financial analysis courses.
Students learn how to import, pre-process, and store financial data at the start of the course, as well as how to change current data by creating new variables utilizing multiple columns. Later modules teach students how to use regression models to predict stock returns. Finally, students learn how to assess a model's performance using statistical and financial standards like the Sharpe Ratio and Maximum Drawdown.
Students should have a basic understanding of python and probability before enrolling in this intermediate-level financial analysis course. On the course platform, a Jupyter Notebook environment has been put up to allow students to practice python coding and financial analysis topics covered in the course. Client programs are not required to be installed.
The course is designed for anyone interested in using Python to perform financial analysis. Students will be able to write their own python code to build statistical models to aid in financial analysis by the end of the course.
Key Highlights
- Learn how to use pandas to import, pre-process, save, and visualize financial data. Dataframe
- Learn how to apply key statistical ideas to financial situations (random variable, frequency, distribution, population and sample, confidence interval, linear regression, and so on).
- Using a multivariate linear regression model, create a trading model.
- Learn how to assure the correctness and performance of your financial models utilizing various investment indicators as a technique of evaluation.
This course offers:
- Flexible deadlines: Reset deadlines in accordance to your schedule.
- Shareable Certificate: Earn a Certificate upon completion
- 100% online: Start instantly and learn at your own schedule.
- Intermediate Level: You will get the most out of the course if you have basic knowledge in probability.
- Approx. 13 hours to complete
- Subtitles: Arabic, French, Portuguese (European), Italian, Vietnamese, German, Russian, English, Spanish, Japanese
Duration: 4 weeks, 3-4 hours per week
Rating: 4.4/5Link: https://www.coursera.org/learn/python-statistics-financial-analysis
coursera.org 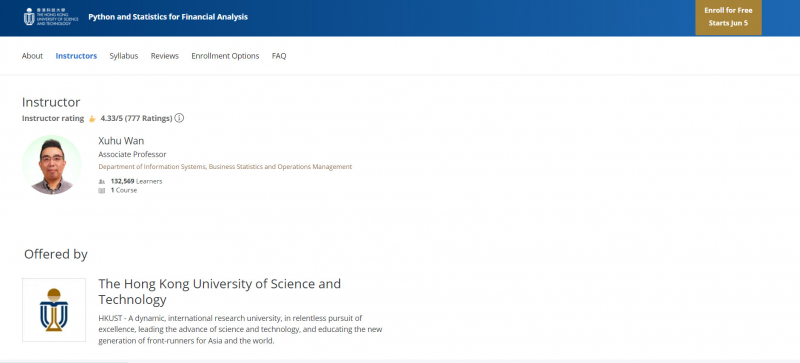
coursera.org -
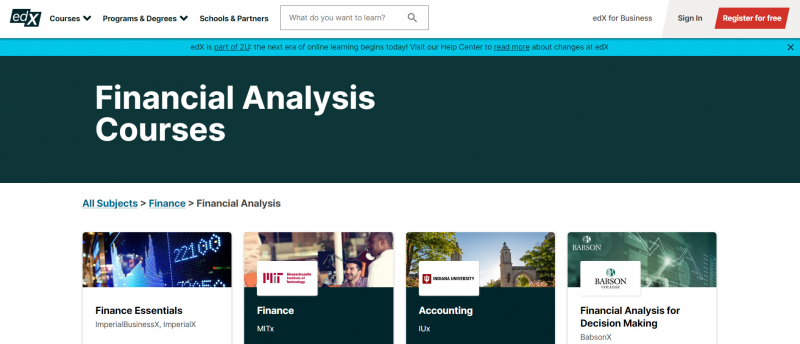
edX is an online learning platform that collaborates with the greatest schools and educational institutions across the world to provide learners with the knowledge and experience they desire. It contains a wealth of online finance courses from the world's finest academic institutions, which you can utilize to master financial analysis and get started on your path to being a great financial analyst. There are courses for people of different levels, from those who want to learn the basics of financial analysis to those who want to go further into a topic. The majority of these courses and training programs can be audited for free. You will have access to all of the course training videos and assignments, but you will not receive a certificate of completion. A minimal charge is required to obtain a verified certificate.
The following are some of the most popular Financial Analyst courses:
- Babson College's Financial Analysis for Decision Making - This course will demystify financial analysis and assist you in making sound business decisions. You'll learn how to assess the financial sustainability of business initiatives and acquire finance to start and expand your company.
- New York Institute of Finance (NYIF) Risk Management - This professional certificate program offers a thorough examination of risk management practice. The various categories of risk, risk management methods and approaches, and financial rules are all covered here.
- ColumbiaX offers a professional certificate program in corporate finance that teaches you the skills you'll need to make great financial and investment decisions. You will gain a comprehensive understanding of both strong theoretical financial principles and the real environment in which financial decisions are made, as well as a complete foundation for valuation.
- UMGC and USMx MicroMasters in Accounting and Financial Management - This curriculum will provide you with hands-on experience reporting and evaluating corporate financial activities. You'll learn how to conduct financial analyses and modeling, evaluate the risks and returns of various investments, and make sound financial management decisions.
- New York Institute of Finance (NYIF) Cash Flow Analysis - The statement of the cash flow will be covered in this course, including cash flow from operations, cash flows after investment, and cash flows after financing.
- New York Institute of Finance (NYIF) Ratio Analysis - This course covers the many ratios used in corporate financial analysis and how to adapt them to determine a company's creditworthiness.
Key Highlights
- Learn from world-class instructors at leading academic and industry institutions.
- Individual Courses, Professional Certificates, and Micromaster Programs are among the available options.
- Courses are built with real-world examples and case studies to provide learners with hands-on training.
- The courses offer a flexible schedule and can be done at your leisure.
- There are courses for all ability levels – beginner, intermediate, and advanced – accessible.
- All course materials, including video lectures, quizzes, and activities, are available for free. Option to add a verified certificate by paying a nominal charge.
This course offers:
- Estimated 4 weeks: 4–6 hours per week
- Self-paced: Progress at your own speed
- Free: Optional upgrade available
Duration: 4 weeks, 4–6 hours per week
Rating: 4.5/5
Link: https://www.edx.org/learn/financial-analysis
-
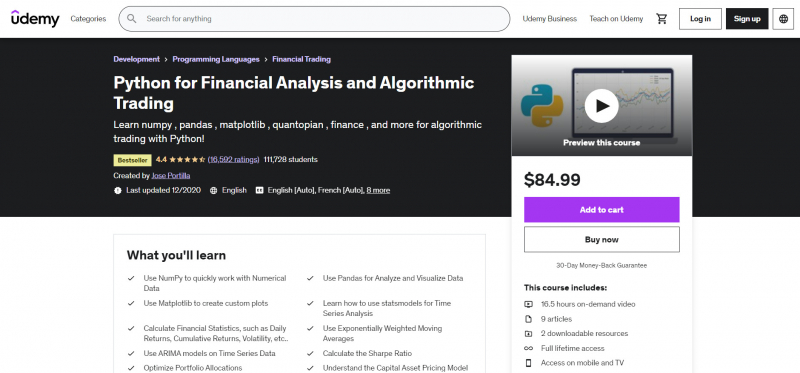
This course provides a thorough introduction to financial analysis and how Python may be used to analyze financial data and perform algorithmic trading.
Jose Portilla, who has taught millions of students on Udemy in areas including programming, data science, and machine learning, designed this course. He works with Fortune 500 corporations, including some of the world's leading banks and financial institutions, as a corporate technical trainer. Jose created this course using the same technical training materials that he has used for personal corporate training at some of the world's most prestigious financial organizations.
The course's curriculum is comprehensive and well-organized. It begins with a basic crash course in Python for a quick study of the programming language before moving on to the core libraries utilized in the analysis, such as numpy, pandas, and matplotlib. The book then goes over how to use Python to work with time-series data, including how to use the statsmodels package. It also covers pandas-DataReader and the Quandl Python API, as well as how to utilize Python to get financial securities data. Quantopian, one of the greatest online platforms for algorithmic trading with Python, is also taught to students.
Students will receive a range of materials in this course, including video lectures, code and explanation notebooks, and extra material. Although the course is appropriate for students of various levels, it is required that they have a basic understanding of Python programming as well as some knowledge of fundamental statistics and linear algebra.Key Highlights
- Use NumPy to work with numerical data fast.
- Pandas can be used to analyze and visualize data.
- Create custom plots with Matplotlib.
- Learn how to perform Time Series Analysis with Statsmodels.
- Financial statistics such as daily returns, cumulative returns, volatility, and so on can be calculated.
- Exponentially Weighted Moving Averages should be used.
- On-Time Series Data, Use ARIMA Models
- Determine the Sharpe Ratio.
- Allocations in the Portfolio Should Be Optimized
- Learn about the CAPM (Capital Asset Pricing Model).
- Find out what the Efficient Market Hypothesis is all about.
- Make algorithmic decisions. Quantopian is a platform for trading.
- Access to an online Q&A forum and Gitter chat rooms where students can interact with one another.
- Obtain a completion certificate to add to your LinkedIn profile and share with potential employers.
This course offers:
- 16.5 hours on-demand video
- 9 articles
- 2 downloadable resources
- Full lifetime access
- Access on mobile and TV
- Certificate of completion
Duration: 16.5 hours on-demand video
Rating: 4.4/5
Link: https://www.udemy.com/course/python-for-finance-and-trading-algorithms/
udemy.com 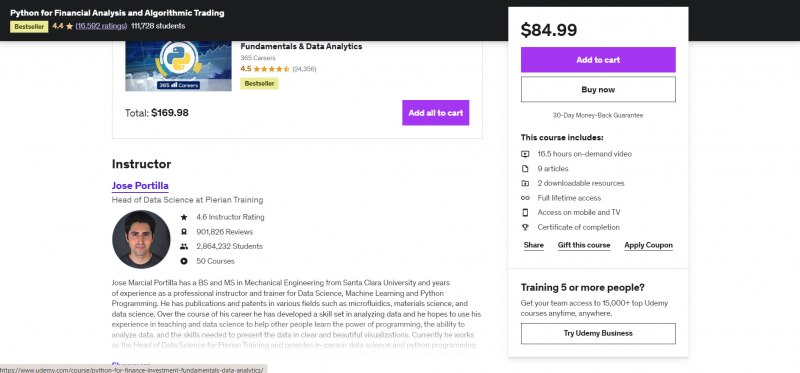
udemy.com -
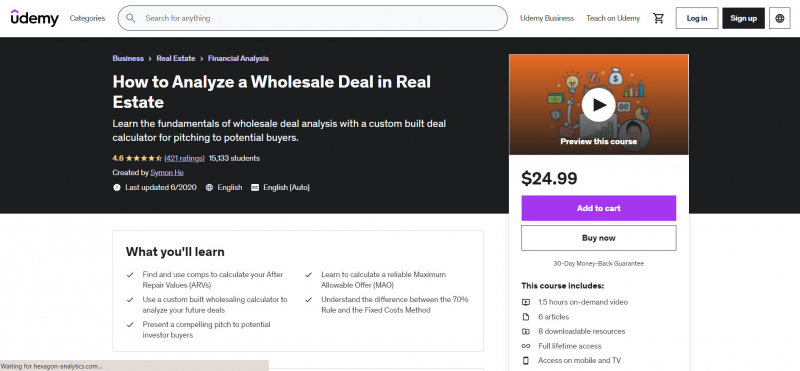
This real estate financial analysis course covers the principles and skills that are needed to understand how to evaluate a wholesale contract. It is a beginner's course for those who have little or no experience in real estate. It teaches the basics of real estate and how to conduct an investment study for a wholesaling transaction. When analyzing wholesale deals, students learn to compute and evaluate the most important numbers. They also receive a custom-built wholesaling transaction calculator, which makes the entire analyzing process easier. This calculator can be used to predict exact after-repair valuations, maximum permitted offers, and rehab expenses.
Simon He, the bestselling real estate educator on Udemy, is the creator and instructor of this course. Simon has an MBA from Stanford University and has worked at a private equity firm on dozens of multi-million dollar investment possibilities. On Udemy alone, he has taught over 200K students and has thousands of five-star reviews.
Key Highlights
- Learn some serious real estate investing tactics, tools, and expertise.
- Recognize the differences between the 70% Rule and the Fixed Costs Method.
- Learn what the Maximum Allowable Offer is, why it's important, and how to figure it out.
- Learn what the After Repair Value is, why it's important, and how to calculate it using comps (ARVs)
- To analyze your prospective deals, use a custom-built wholesaling calculator.
- Learn how to make a powerful pitch to potential investors.
- Learn how to sell your property to a flip investor or a buy-and-hold investment.
This course offers:
- 1.5 hours on-demand video
- 6 articles
- 8 downloadable resources
- Full lifetime access
- Access on mobile and TV
- Certificate of completion
Duration: 1.5 hours on-demand video
Rating: 4.5/5
Link: https://www.udemy.com/course/wholesaling-investment-analysis/
udemy.com 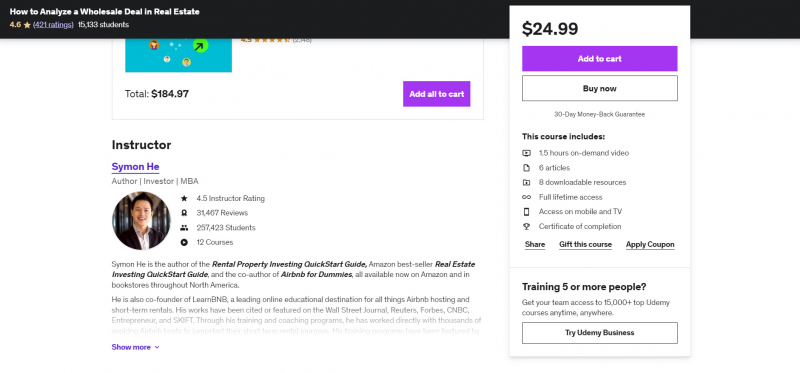
udemy.com -
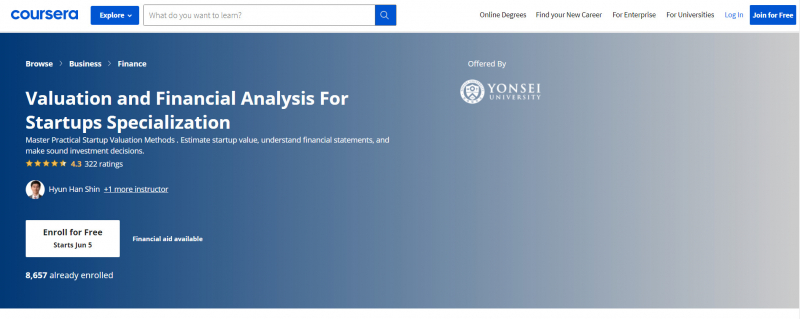
One of the most in-demand talents among entrepreneurs, venture capitalists, and private equity firms today is financial analysis and valuation. This specialization provides students with in-depth knowledge of start-up valuation and financial analysis, preparing them to analyze real-world start-ups.
Hyun Han Shin, a finance professor at Yonsei School of Business, created this specialism. He has more than 25 years of expertise teaching finance and has received numerous exceptional research honors and accolades. He has incorporated both the theory and application of financial analysis and valuation in this course, so learners will find it quite valuable in their daily business decisions. His Yonsei School of Business colleague Saeyeul Park is a co-instructor on the course.
This is a beginner-level training program that requires no prior expertise. As a result, this training is suitable for anyone who is new to accounting and finance. There are four courses in total, including a capstone project at the end. The four courses will take 14 weeks to complete, with the capstone project taking 3-4 weeks. As a result, the Specialization can be completed in as little as 17-18 weeks.
Key Highlights
- Learn how to generate financial estimates and how to utilize financial analysis to determine a company's worth.
- Discover the time value of money, discounted cash flows, different methods, financial statement analysis, free cash flows, capital budgeting decision rules, and current trends.
- Financial statements such as the balance sheet, income statement, and cash flow calculation should all be understood.
- Learn how to calculate the present value of future cash flows using Excel.
- Real-life examples are used to teach.
- Using the principles taught in the course, complete a capstone project to determine the worth of startups.
This course offers:
- Shareable Certificate: Earn a Certificate upon completion
- 100% online courses: Start instantly and learn at your own schedule
- Flexible Schedule: Set and maintain flexible deadlines
- Beginner Level: No prior experience required
- Approximately 6 months to complete: Suggested pace of 2 hours/week
- Subtitles: English, Arabic, French, Portuguese (European), Italian, Vietnamese, Korean, German, Russian, Spanish
Duration: 6 months, 2 hours per week
Rating: 4.3/5
Link: https://www.coursera.org/specializations/startup-valuation/
coursera.org 
coursera.org -
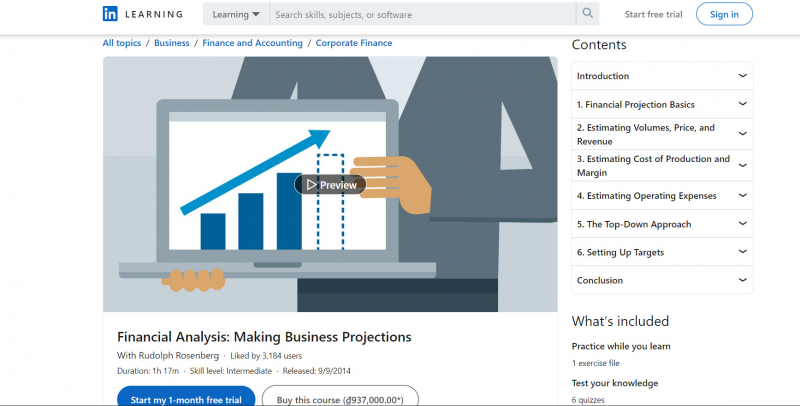
This is the first in a series of Rudolph Rosenberg's Financial Analysis courses on LinkedIn Learning, and it gives you a fast overview of the essential ideas of business performance analysis. This course focuses on how to examine a company's PNL (profit and loss) and gain the knowledge needed to run a firm using practical methodologies. Understanding the information contained in a firm's profit and loss statements aids in making well-informed decisions that benefit the company in the long run.
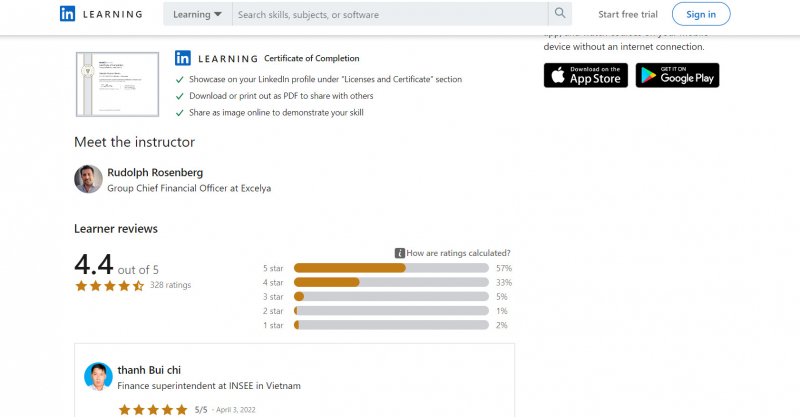
The course's instructor, Rudolph Rosenberg, is a global finance and business executive who brings over 20 years of experience to this course. This is a short course with little over 20 minutes of video content that serves as an introduction to the essential ideas and serves as a stepping stone to Rudolph's other financial analysis courses:
- Financial Analysis: Using Excel to Examine the Top Line — This course covers practical methods for analyzing a company's top line, or revenue. It explains the financial concepts required to comprehend revenue performance, identifies the origins of under or over performance, and covers procedures for gathering, preparing, and analyzing data using Microsoft Excel, which every firm has access to.
- Financial Analysis: Using Excel to Examine the Bottom Line — This course covers the financial fundamentals that are required to comprehend gross margin and operating expense performance. It teaches students how to use Excel's tools and techniques to prepare and analyze data, such as PivotTables and the useful SUMIF function. It also teaches how to separate and analyze sales and marketing spending, staff expenditures, and productivity so that a clear image of the data can be obtained from many perspectives.
Key Highlights
- Examine the important dynamics you'll need to know in order to interpret your company's performance.
- Learn how to analyze financial data with Excel.
- Exercises to put the course's contents into practice
- For a 30-day trial period, you will have free access to all course materials.
- Practice while you learn: 1 exercise file
- Test your knowledge: 6 quizzes
- Learn on the go: Access on tablet and phone
- Stay up to date: Continuing Education Units
Duration: 1-hour on-demand video
Rating: 4.4/5
Link: https://www.linkedin.com/learning/financial-analysis-making-business-projections
-
An analyst's job is dynamic, complex, and requires a wide range of talents. These abilities range from a fundamental comprehension of financial statement data and non-financial performance measurements to a deeper dive into business and financial modeling. To make informed financial decisions and investments, analysts use spreadsheet models, modeling methodologies, and common investment analysis applications as part of their arsenal.
This complex concentration will prepare a learner for a career in the fast-paced world of data and business research, as well as a better technical understanding of finance and quantitative modeling. You'll learn how to use spreadsheets to put data to work and how to use spreadsheets as a strong, accessible data analysis tool, starting with the principles of quantitative modeling. You'll also learn about corporate finance and get a deeper knowledge of finance basics through a number of real-world scenarios ranging from personal finance to business decision-making and financial intermediation.
Key Highlights
- Harness the power of spreadsheets to map and predict data
- Create your own quantitative models
- Read income and cash flow statements
This course offers:
- Shareable Certificate: Earn a Certificate upon completion
- 100% online courses: Start instantly and learn at your own schedule.
- Flexible Schedule: Set and maintain flexible deadlines.
- Beginner Level: No prior experience required.
- Approximately 4 months to complete: Suggested pace of 2 hours/week
- Subtitles: English, Arabic, French, Portuguese (European), Italian, Vietnamese, German, Russian, Spanish, Portuguese (Brazilian), Korean
Duration: 4 months, 2 hours/week
Rating: 4.5/5
Link: https://www.coursera.org/specializations/finance-quantitative-modeling-analysts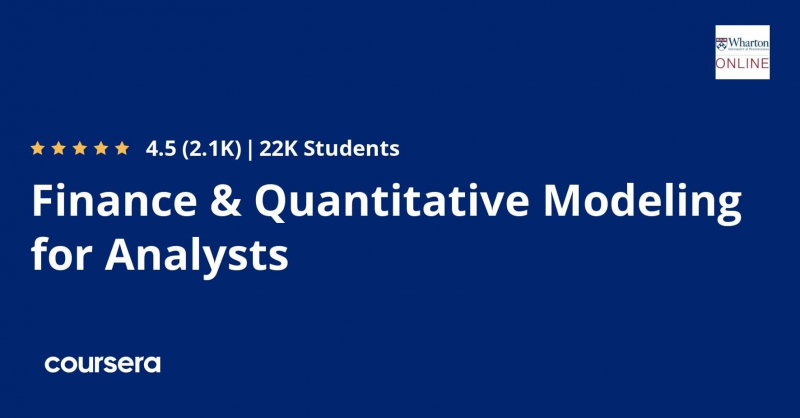
coursera.org