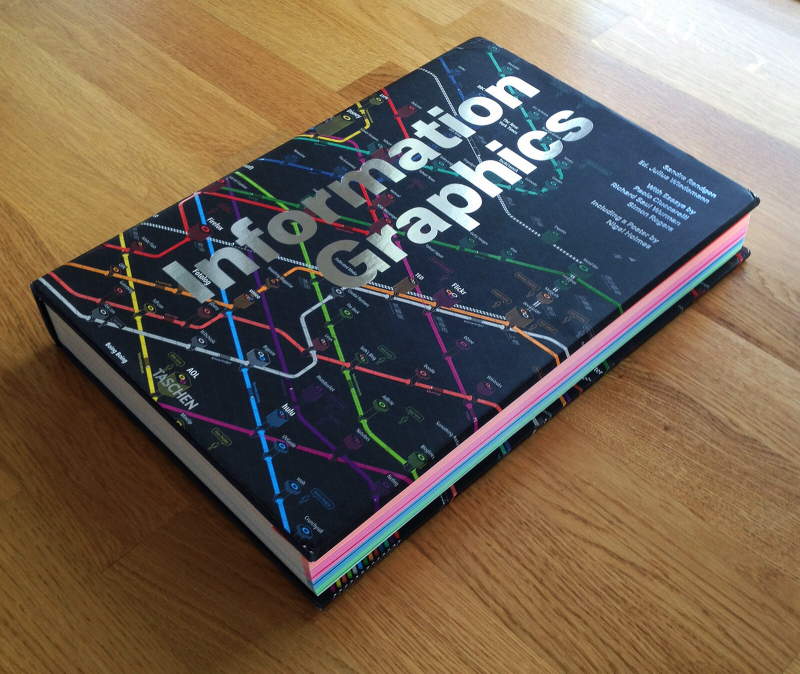
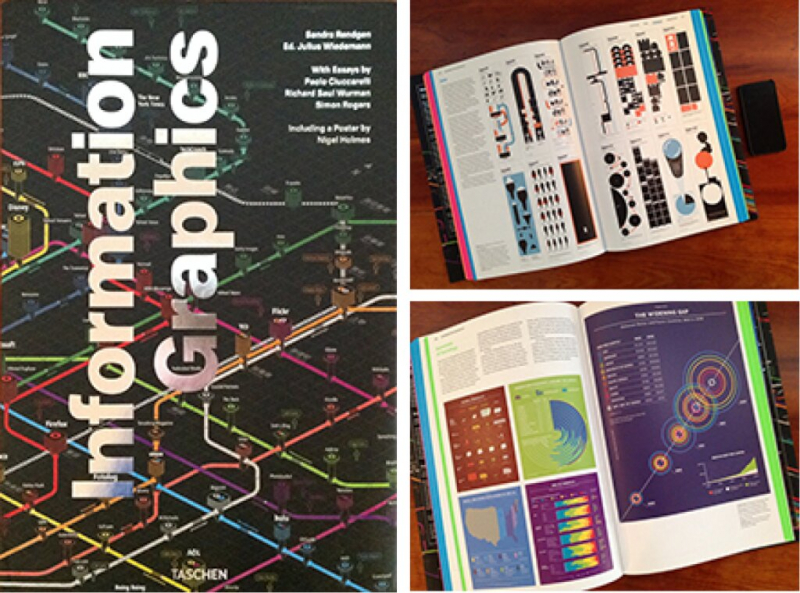
Information Graphics
Information Graphics is an interesting, beautifully written book about the evolution of visual communication in the age of big data. Anyone interested in the history and practice of modern visual communication would find this valuable, as it was conceived and created for a broad audience.
Our daily lives are flooded with vast amounts of data that we must decipher to comprehend the world we live in. Given the vast diversity of data that surrounds us, visual communication is sometimes the greatest, if not the only, method to communicate. This one-of-a-kind book offers a fresh viewpoint on the subject, spotlighting the work of the industry's masters, innovators who have altered the way we interact. Information Graphics was created not just for graphic designers, but for anybody interested in the history and practice of visual communication.
The book is divided into two sections and co-authored by Sandra Rendgen and Julius Wiedemann. The first features introductory pieces on the early history of data visualization (one of the studies, for example, looks at prehistoric cave drawings as a way of communication) as well as the ideas that drive it. The second section contains over 200 projects and 400 examples of graphical data from across the world, including disciplines like media, government, education, business, and more.
"It's a daring book that doesn't hide behind a plethora of visual design examples, but instead provides a classy framework for showcasing the many fantastic instances of data narrative. It's a book to leaf through, leap through, and flip through, a publication you'll have in your hands for a long time and return to enjoy or, more importantly, recharge your design batteries." ― Urban Tick.
Author: Sandra Rendgen
Language: English
Link buy: https://www.amazon.com/Information-Graphics-Sandra-Rendgen/dp/3836528797


