Top 10 Best Online Infographics Courses

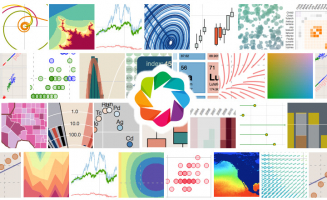
Infographics have the ability to distill and simplify broad or complex ideas. You can get all the data, stats, and highlights you need in one colorful, ... read more...creative, and engaging Infographic instead of sifting through a large amount of information. Here are the best online infographics courses to get you started if you're interested in learning about them.
-
Animated infographics are an excellent way to visualize data and explain complex concepts in a straightforward and engaging manner. However, creating an infographic video from scratch can be difficult. They not only take a long time to complete, but they also necessitate a great deal of knowledge and skill in a program like After Effects.
The instructor learned some effective workflow tips to help him create this data-driven infographic over the footage after many years on the job, and now you can too. He'll go over a lot of key workflow concepts as well as tips and tricks so you can make this animation.
You'll start with a Thumbnail sketch and then you'll bring it into After Effects where we will design and animate your graphics. You will put your graphics over live action footage. At the end of the course, you'll have built up a library of assets that you can re-use in addition to creating this animation. Also, throughout the course, the instructor will supply working project files so that you can use them as a downloadable resource.Who this course is for:
- Motion Designers
- After Effects Artists
- Anyone looking to expand their After Effects skills
Requirements
- Basic knowledge of After Effects
- After Effects CC17
Course ratings: 5.0/5
Enroll here: https://www.udemy.com/course/creating-data-and-infographics-in-after-effects/

atlantedelleprofessioni.it 
fishbat.com -
This class will teach you how to make stunning Infographics to share your ideas, projects, and more. You'll also discover how to gain access to millions of royalty-free professionals. Photos and images to use in your infographic, website, blog, or any other project you may be working on.
You'll also learn where to find Royalty Free Icons and 4 websites where you can get unlimited free images to use in your Infographic, website, or any other design. This course does not necessitate any prior knowledge. You can make these super professional infographics if you have access to a computer and the internet. This course is for anyone who wants to use Infographics to share their ideas and projects.
Who this course is for:
- Students, professionals, parents, entrepreneurs, this course is for everyone.
- This course is for anyone that would like to share their ideas and projects using Infographics.
Requirements
- There is not prior knowledge required to complete this course. If you have access to a computer and internet, you can create these super professional infographics.
Course ratings: 4.7/5
Enroll here: https://www.udemy.com/course/infographic/

saastronautics.com 
hongkiat.com -
Do you want to be more innovative at work and make each Excel project stand out? Do you want to impress your users, whether they're clients, customers, your boss, or anyone else? Get started learning Excel animation and become highly wanted.
From beginner to master level, everything in this course is covered step by step. VBA (Excel's programming language) is used to create animations, but it's a breeze, and it's even easier than writing some Excel formulas like Vlookup. You'll also learn how to record macros and modify the codes to achieve any desired animation, in addition to learning concepts and writing simple codes. This means you'll not have to take the stress of remembering codes and yet understand how things work and when required you'll be able to write animation codes from the scratch.
This course is guaranteed to be entertaining, as you will be amazed to see yourself animating your imagination right inside Excel. By the end of the course, you'll have learned a variety of techniques for creating professional animation for any project. And if you get stuck or want to try out some new animation ideas, just post your questions on the Udemy forum, where the instructor is always available to help.Who this course is for:
- Anyone wanting to add professional animations to excel projects such as animated splash screens, animated menus, text animations, graph animation and any creative animation you can think of or have come across and turn any Excel projects a professional work
- Anyone wanting to add professional animations to excel projects
- Anyone who loves animation in general and want to take Excel skill to the next level
- Anyone who likes to get creative at work
Requirements
- Basic working knowledge of Microsoft Excel
- You would preferably need Excel 2010 or above, though you should still be able to follow with 2007 version.
Course ratings: 4.6/5
Enroll here: https://www.udemy.com/course/microsoft-excel-animation-for-great-user-experience/

hubeditoriale.it 
hubeditoriale.it -
By enrolling in this course, you will learn how to create infographics and how to animate them using the after effects software. This course takes you from the ground up until you've mastered infographic design and are ready to move on to the next level. After completing this course, you will have the tools and techniques necessary to create any type of infographic you desire with minimal effort and in a short period of time.
This course creates five different designs to teach you how to make a variety of infographics. You will find the designs shown in the course attached with the course as an open source files so that you can use them. The course is divided into two parts, one for designing the infographics and the other for animating them.
Who this course is for:
- Motion Graphics Designers
- Anyone that want to learn to create animated infographics
Requirements
- Adobe After Effects
Course ratings: 4.6/5
Enroll here: https://www.udemy.com/course/animated-infographics-with-after-effects/
smartbugmedia.com 
edrawsoft.com -
This is a one-of-a-kind Udemy course that teaches you how to use Expressions to create animated infographics. It is not a case of demonstrating how to use a phrase. It's all about creating complete infographics projects with all of the necessary controls that are driven by expressions.
You'll learn how to make Graphic Percent Infographics with Graphics and Icons, Staked Graphics Percent Infographics, Battery Charger Simulation - with Microsoft Excel data to Motion Graphics Bar Graphs and Data Visualization, Animated Radials Infographics, and more in this course. You'll also learn how to use expressions to create a complete project animation, how to use expression control effects to create complex animations with variable data, and how to create control templates for all infographics.
The instructor will show you how to make infographics from start to finish. You'll also know the different types of infographics and graphs that you can use to create animated infographics. This is a project-based course, so you'll have access to all of the project files to practice with. If you're new to After Effects, this course will teach you how to create useful and practical animations while learning how to create Infographics.
Who this course is for:
- After Effects users who want to develop their skills using expressions
- Want to create Animated Infographics
- Want to learn Data Visualization
Requirements
- Beginner's knowledge in After Effects
- How to work with basic transformation, Timeline layers, parenting and trackmattes.
- Adobe After Effects ver 2021 (preferably) and beyond
Course ratings: 4.6/5
Enroll here: https://www.udemy.com/course/adobe-after-effects-expressions-create-motion-infographics/

commlabindia.com 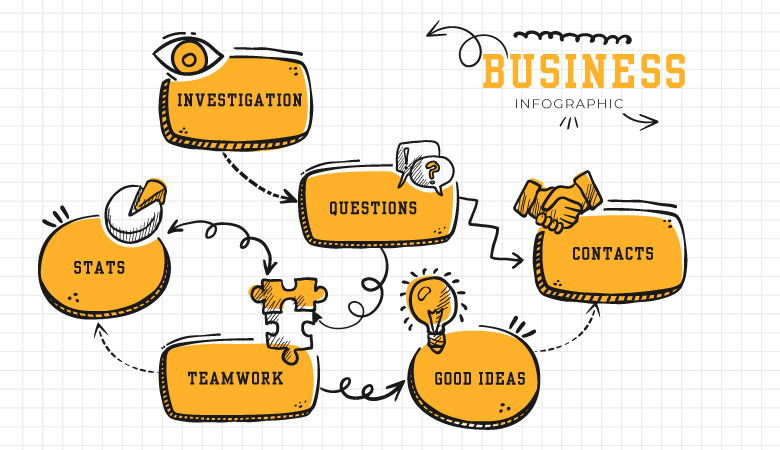
vieclam.thegioididong.com -
Have you spent countless hours searching YouTube for useful content on Excel Dynamic Charts only to be disappointed? What if you could learn how to create professional-looking Excel graphs and infographics in just a few hours?
Data visualization is an effective means of conveying information. Excel charts are a good way to visualize data and communicate results. Some application charts are popular and widely used in addition to the chart types available in Excel. You will learn about advanced charts and how to make them in Excel in this course. From shapes to conditional formatting to charts, this course will walk you through Excel's data visualization features. The instructor includes several realistic case studies so you can see how a business question can turn into a chart or dashboard.
You'll have access to over 50 examples and files that are relevant to your work. You can download and use them right away, along with the code-free version. Sign up today for lifetime access to over 7 hours of high-quality video content, downloadable project files, quizzes and homework exercises, and one-on-one support if you're a professional looking to become more efficient at building excel reports and dashboards. By the way, don't forget to print the certificate of completion at the end of the course.
Who this course is for:
- Excel users who wants to learn how to create Excel Charts
- Students with a willingness for learning
- Business Professionals + Entrepreneurs
Requirements
- This course was recorded with Excel 2019 and Excel 365 but it's also compatible also with Excel 2016, 2010 and 2013
- It is also compatible with Microsoft Office for Mac
- Only basic prior experience in Excel 2016 or spreadsheets is required to get the most out of this Excel course
Course ratings: 4.6/5
Enroll here: https://www.udemy.com/course/create-excel-charts-and-graphs-in-2-hours/
infographicdesignteam.com 
dailyinfographic.com -
This course, one of the best online infographics courses, will teach you how to create an effective and engaging Infographic that will be shared by everyone. You'll learn how to make an Infographic in Adobe Illustrator, one of the most popular graphics editing programs, from start to finish. The course will begin with an introduction to infographics, in which you will learn the fundamentals of infographics and how to create them. Why would you want to make an infographic? Infographics, on the other hand, allow you to communicate and simplify complex information in a visually appealing and engaging manner.
Because they draw attention and encourage social sharing, infographics are a great way to engage readers. An infographic that has been well-thought-out and well-designed will be shared across social media platforms and on websites.
Infographics are great for building brand awareness and getting a specific message across, in addition to their SEO benefits. Consumers do not want to read a lot of information, and it is a proven fact that most people absorb information better when it is presented visually. Infographics are being used by businesses to engage their target market and drive traffic to their websites.
Infographics communicate an idea simply and quickly, regardless of the purpose, and are a huge asset for any brand, business, educator, designer, or blogger as more and more content is funneled through the Internet every day. You'll know how to make an infographic by the end of this course, and you'll be ready to tackle your next project.
Who this course is for:
- Anyone wanting to learn how to create an awesome Infographic
- Graphic Designers
- Bloggers
- Website Owners
- Marketers
Requirements
- Access to Adobe Illustrator (free trial available)
Course ratings: 4.5/5
Enroll here: https://www.udemy.com/course/infographic-design-how-to-create-your-own-infographic/
infographicdesignteam.com 
infographicdesignteam.com -
With this course, you’ll learn about the different software programs available to create infographics, and you will be focusing on using Canva, which is super easy to use and intended for non designers.
You'll learn what makes an infographic effective, where to find templates, and how to fill out an infographic step by step. You can follow along and have your own infographic ready to go by the end of the course. These infographics, as well as their individual components, can be made into any type of social media post if desired. As a result, that could be useful as well.
If you're a freelance medical writer, for example, you can create infographics for your own use or to provide as a visual for your clients. If you're a graduate student or postdoctoral researcher, an easy-to-understand infographic, downloadable from your website, might be an interesting way to raise awareness about your research. Rather than reading a long piece of text, everyone prefers to look at an interesting infographic. No worries if you've never used Canva before; it's very simple to use.
Who this course is for:
- Anyone who wants to create an infographic using Canva, especially those with an interest in science or medicine
Requirements
- None. No design experience needed
Course ratings: 4.4/5
Enroll here: https://www.udemy.com/course/creating-infographics-with-canva/
freepik.com 
digitalmarketingphilippines.com -
During this course, you'll look at a current real-world issue and learn how to create amazing infographics with great visual representation, as well as being creative and eye-catching. You'll learn how to research your topic, how to tell a story, and how to maintain a visual hierarchy by using style and color scheme. This is the ideal time to put your skills to the test with a simple but well-designed infographic. You'll learn how to research and sketch your visual graphic, as well as how to create a simple but effective infographic.
Create an infographic with at least 10 icons to convey a message or raise awareness for this course's assignment. Use what you've learned about how to best represent various types of data. Assemble the elements relevant to the story icons into a large, cohesive graphic using your imagination.
Any software that you are familiar with can be used to create the infographic. Illustrator, Photoshop, InDesign, Excel, Prezi, Tableau, or just pen and paper are all options. The instructor will guide you through the process of conducting research, locating icons, sketching, layout, electronic development, and finally adding style.
Who this course is for:
- Anyone who loves to explore infographics design and learn to use style and layout to tell a story.
- Students, teachers, entrepreneurs, etc. with any level of knowledge
- Anyone who wants to learn how to effectively represent data/information through an infographic
Requirements
- Pen/Pencil & Paper
- Any software you are familiar with: Power Point, Illustrator, Photoshop, InDesign etc
Course ratings: 4.4/5
Enroll here: https://www.udemy.com/course/create-infographics-and-tell-a-story/

benchmarkone.com 
onlineprinters.co.uk -
This course will equip you with all of the tools, knowledge, and skills necessary to create any type of presentation slide or information. You can learn PowerPoint from the ground up and become a professional designer with this course! After completing this course, you will have a solid understanding of how to work efficiently in PowerPoint without wasting time and effort, the ability to produce high-quality slides and presentations (including videos and graphics) to industry standards, and a stronger understanding of Designing, Presenting, and Animating to help you advance as an active Entrepreneur, Creator, and Content publisher.
There are five sections to the course. Section 1 provides an overview of this course as well as instructions on how to add new fonts to your computer and PowerPoint presentation. In section 2, you'll learn how to properly use the software and get a quick overview of its most important features and tools.
This course's main slide and presentation design section is found in Section 3. Because you've already learned the fundamentals in the previous chapters, it's time to bring in the big guns and design things like logos, business cards, infographics, and combining photos with custom shapes. In section 4, you'll learn how to use animation properly. Learn about the various types of animation and how to work with the animation timeline properly. The course comes to a close in Section 5.
Who this course is for:
- Students who wanna learn PowerPoint Basics tools.
- Students who wanna reach to Professionality level in PowerPoint Design.
- Students who wanna greatly improve their PowerPoint skills and impress others with their advanced presentations.
- People who wanna create logo , business cards or any graphics design by using simple ways.
- People who wanna create and publish explainer videos and animations with PowerPoint.
Requirements
- PowerPoint versions such as 2016 / 2018 / 2019 / 2020 / 2021 (or Microsoft 365) Installed for PC or Mac.
- Passion for learning.
Course ratings: 4.3/5
Enroll here: https://www.udemy.com/course/professional-powerpoint-presentation-design-animation/

searchenginejournal.com 
tsaksconsulting.com