Top 7 Best Online Rstudio Courses

RStudio is an integrated development environment for R, a statistical computing and graphics programming language. It comes in two different formats: RStudio ... read more...Desktop is a standard desktop program, but RStudio Server is a web-based application that operates on a remote server. Thus, to satisfy the burgeoning demand for online yet qualifying courses, Toplist has compiled a rundown of the Best Online Rstudio Courses for those in need.
-
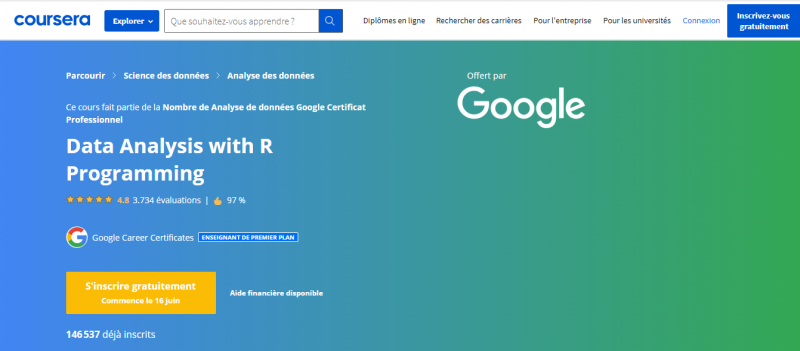
Data Analysis with R Programming is one of the Best Online Rstudio Courses. This is the seventh of the Google Data Analytics Certificate's seven courses. These classes will provide you the abilities you'll need to apply for entry-level data analyst employment. This course will teach you how to use the R programming language. You'll learn how to work with R using RStudio, a programming environment. This course will also go over R-specific software programs and tools, such as R packages. You'll learn how to clean, organize, analyze, display, and report data in new and more powerful ways using R. Current Google data analysts will continue to teach and demonstrate how to complete basic data analyst duties using the most up-to-date tools and resources.
Graduates of this certificate program will be prepared to apply for entry-level data analyst positions. It is not essential to have any prior experience.
What you will learn:
- Describe the R programming language and its programming environment
- Explain the fundamental concepts associated with programming in R including functions, variables, data types, pipes, and vectors
- Describe the options for generating visualizations in R
- Demonstrate an understanding of the basic formatting R Markdown to create structure and emphasize content
This course offers:
- Flexible deadlines
- Get a Certificate when you complete
- 100% online
- Course 7 out of 8 in the Google data analysis
- Beginner level
- Approx. 37 hours to complete
- Subtitles: English
Rating: 4.8/5
Enroll here: https://www.coursera.org/learn/data-analysis-r
coursera.org 
coursera.org -
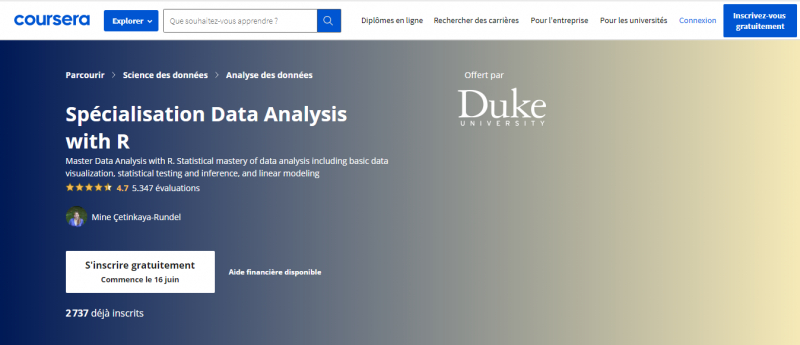
This Specialization will teach you how to analyze and visualize data in R and create reproducible data analysis reports, how to demonstrate a conceptual understanding of the unified nature of statistical inference, how to perform frequentist and Bayesian statistical inference and modeling to understand natural phenomena and make data-based decisions, how to communicate statistical results correctly, effectively, and in context without relying on statistical jargon, and how to critique data-based claims.
You'll create a portfolio of data analysis projects from the Specialization that demonstrates mastery of statistical data analysis from exploratory analysis to inference to modeling, which you may use to apply for statistical analysis or data scientist jobs. You will receive a Certificate once you have completed all of the courses and the practical project, which you can share with potential employers and your professional network.
What you will learn:
- Analyze and visualize data
- Perform hypothesis tests, interpret statistical results (e.g., p-values), and report the results of your analysis to clients
- Fit, examine, and utilize regression models to examine relationships between multiple variables
- Install and use R and RStudio
This course offers:
- Shareable certificate: Get a Certificate when you complete
- 100% online courses
- Planning flexible
- Beginner level
- Approximately 5 months to complete (Recommended pace of 2 hours/week)
- Subtitles: English, Arabic, French, Portuguese (European), Italian, Vietnamese, Korean, German, Russian, Spanish
Rating: 4.7/5
Enroll here: https://www.coursera.org/specializations/statistics
coursera.org 
coursera.org -
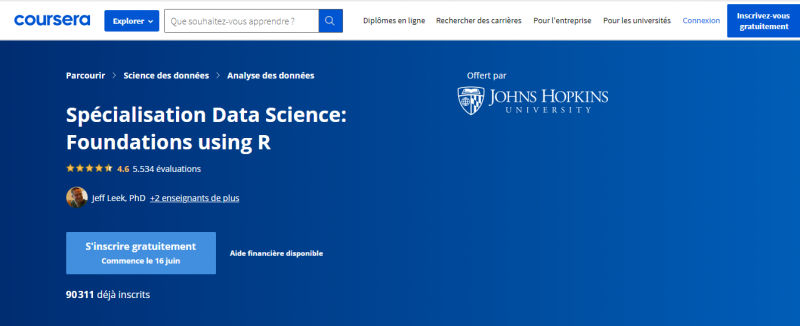
One of the Best Online Rstudio Courses is Data Science specialization: Foundations using R. This Specialization covers fundamental data science tools and techniques, such as how to collect, clean, and explore data, how to program in R, and how to perform repeatable research. Learners who finish this specialty will be prepared to take the Data Science: Statistics and Machine Learning specialization, which will require them to create a data product using real-world data. The five courses in this specialty are the same as those in the Data Science Specialization's first part. This specialty is designed for students who want to begin and finish the basic portion of the program before going on to more advanced Data Science courses such as statistics and machine learning.
Learners who enroll in the Data Science: Foundations using R Specialization will complete a project at the conclusion of each course. Installing tools, programming in R, cleaning data, executing analysis, and peer review assignments are all part of the projects.
What you will learn:
- Use R to clean, analyze, and visualize data.
- Learn how to ask the right questions, obtain data, and perform reproducible research.
- Use GitHub to manage data science projects.
- Set up R, R-Studio, Github and other useful tools
This course offers:
- Get a Certificate when you complete
- 100% online courses
- Planning flexible
- Beginner level
- Approximately 5 months to complete (Recommended pace of 8 hours/week)
- Subtitles: English, Arabic, French, Portuguese (European), Italian, Vietnamese, Korean, German, Russian, Spanish, Chinese (Simplified), Portuguese (Brazilian), Japanese
Rating: 4.6/5
Enroll here: https://www.coursera.org/specializations/data-science-foundations-r
coursera.org 
coursera.org -
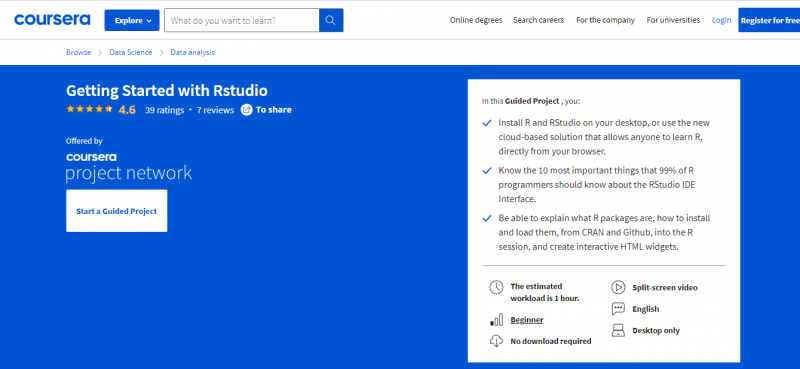
Getting Started with Rstudio is one of the Best Online Rstudio Courses. In this one-hour project-based course, you'll learn how to install RStudio on your Windows, Mac, or Linux machine, how to use RStudio Cloud, a lightweight, cloud-based version of RStudio, how to start creating R projects, install and load R packages, and display interactive maps, graphs, and tables with just one line of code. If you wish to learn R programming with RStudio: the Premiere IDE for R, this course is for you. Note: This course is best suited to students in the North American area. We're working on bringing the same experience to other parts of the world.
In this Guided Project , you:
- Install R and RStudio on your computer, or take use of a revolutionary cloud-based option that allows anybody to study R right from their browser.
- Learn the ten most critical features of the RStudio IDE Interface that 99 percent of R programmers should be aware of.
- Explain what R packages are, how to install and load them into a R session via CRAN and Github, and how to develop interactive HTML widgets.
This course offers:
- The estimated workload is 1 hour.
- Beginner
- No download required
- Split-screen video
- English
- Desktop only
Rating: 4.6/5
Enroll here: https://www.coursera.org/projects/getting-started-rstudio
coursera.org 
coursera.org -
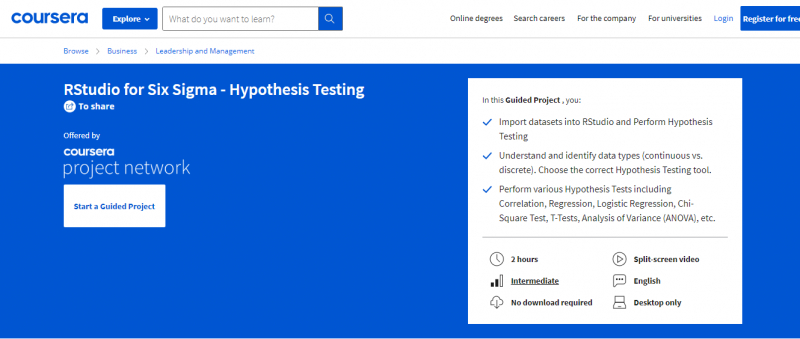
RStudio for Six Sigma - Hypothesis Testing welcomes you, which is one of the Best Online Rstudio Courses. This is a project-based course that should take you around two hours to complete. Please review the course goals and structure before beginning the project.
By the end of this project, you'll know how to identify data types (continuous vs. discrete), what hypothesis testing is, how to choose the right hypothesis testing tool, and how to perform various hypothesis tests such as correlation, simple regression, logistic regression, chi-square test, T-Tests, Analysis of Variance (ANOVA), and non-parametric tests like Wilcoxon Rank Sum and Kruskal Wallis.In this Guided Project , you:
- Import data into RStudio and conduct hypothesis tests
- Recognize and classify various data kinds (continuous vs discrete). Select the most appropriate Hypothesis Testing instrument.
- Correlation, Regression, Logistic Regression, Chi-Square Test, T-Tests, Analysis of Variance (ANOVA), and other hypotheses tests are performed.
Thanks to a split-screen video in your workplace, your teacher will walk you through each step:
- In RStudio, use Scatter Plot, Correlation, and Regression to test hypotheses on continuous X and Y data.
- In RStudio, use Logistic Regression to do hypothesis testing on Continuous X, Discrete Y data.
- Using the Chi-Square Test, test hypothesis on discrete X and discrete Y data in RStudio.
- In RStudio, do hypothesis testing on Discrete X, Continuous Y data. Stability, Shape, and Spread Analysis
- In RStudio, do hypothesis testing on Discrete X, Continuous Y data. ANOVA (Cont Y, Disc X), Non-parametric testing, 1 Sample t-Test, 2 Sample t-Test (Wilcoxon, Moods-Median, Kruskal)
This course offers:
- 2 hours
- Intermediate
- No download required
- Split-screen video
- English
- Desktop only
Rating: 4.4/5
Enroll here: https://www.coursera.org/projects/rstudio-six-sigma-hypothesis-testing
coursera.org 
coursera.org -
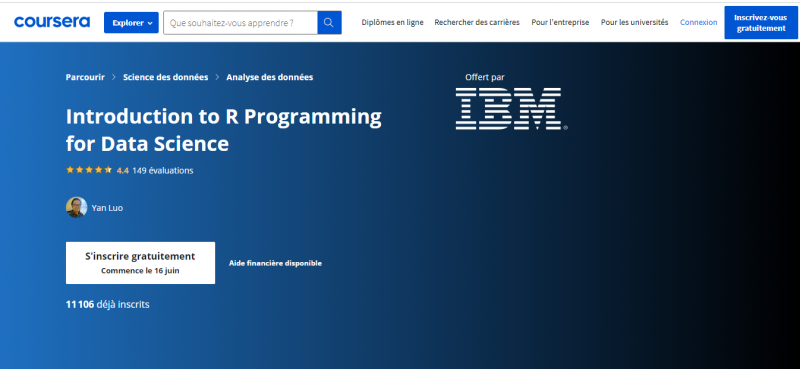
Working in the field of data science will undoubtedly expose you to the R programming language and its importance in data analysis. This course covers the fundamentals of the R programming language, including data types, manipulation techniques, and how to do basic programming tasks. With the aid of the R programming language, you will learn to comprehend typical data structures, programming foundations, and data manipulation. Hands-on and practical learning are emphasized in this training. You'll use RStudio to develop a simple program, manipulate data in a data frame or matrix, and finish a final project as a data analyst utilizing Watson Studio and Jupyter notebooks to collect and evaluate data-driven insights.
This course can be applied to a variety of professional certificate or Specialization programs. This course will credit toward your training in one of the following programs if you finish it successfully:
- Number of IBM Data Analysis with Excel and R Professional Certificate
- Spécialisation Applied Data Science with R
What you will learn:
- Manipulate primitive data types in the R programming language using RStudio or Jupyter Notebooks.
- Control program flow with conditions and loops, write functions, perform character string operations, write regular expressions, handle errors.
- Construct and manipulate R data structures, including vectors, factors, lists, and data frames.
- Read, write, and save data files and scrape web pages using R.
This course offers:
- Flexible deadlines
- Shareable certificate: Get a Certificate when you complete
- 100% online
- Beginner level
- Approx. 12 hours to complete
- Subtitles: English
Rating: 4.4/5
Enroll here: https://www.coursera.org/learn/introducton-r-programming-data-science
coursera.org 
coursera.org -
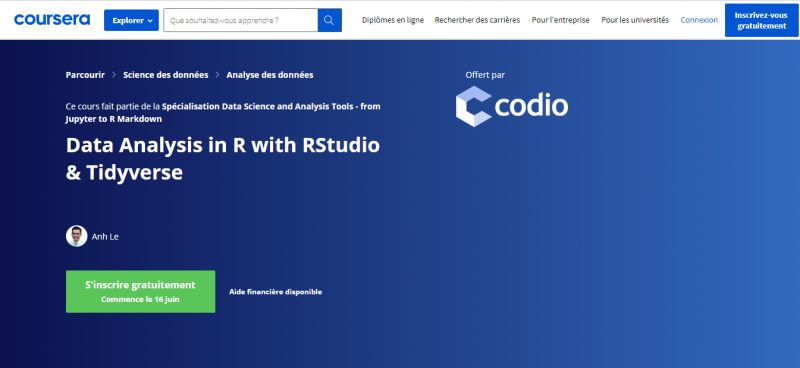
Without installing anything, you can code and execute your first R program in minutes. This course is for those who have never coded before and want to learn the fundamentals of data analysis in R. This course's sections address descriptive statistics, data import and manipulation, and statistical tests for comparing populations and describing connections. This course uses the industry-standard Integrated Development Environment (IDE) RStudio to deliver examples in R.
This course is video-free to allow for a genuinely hands-on, self-paced learning experience. Short explanations with visuals and runnable code examples with recommended adjustments are included in assignments, allowing students to get a better understanding by doing. Along the process, you'll get immediate feedback from a range of assessment tasks, gradually graduating from short comprehension checks (multiple choice, fill in the blank, and un-scrambling code blocks) to tiny, manageable coding projects that take minutes rather than hours. Finally, a cumulative lab at the end of the course will allow you to apply what you've learned in a real-world setting.
What you will learn:
- Describe a numerical data set using statistical functions in R
- Import and manipulate data sets using Tidyverse
- Determine if populations are different using statistical tests
- Use statistical tests to describe or explain the relationship between data sets
This course offers:
- Flexible deadlines
- Get a Certificate when you complete
- 100% online
- Course 3 of 4 in the Spécialisation Data Science and Analysis Tools - from Jupyter to R Markdown
- Beginner level
- Approx. 10 hours to complete
- Subtitles: English
Enroll here: https://www.coursera.org/learn/codio-data-analysis-in-r-with-rstudio-and-tidyverse
coursera.org 
coursera.org