Top 7 Best Books On Infographics

Data is frequently perceived as dull and impersonal, but does it have to be? The most technical and complex data is increasingly being transformed into ... read more...compelling visuals. When it comes to telling stories accurately and creatively, data visualization or information design is becoming the norm rather than the exception. Even if beautiful information design appears to be simple, the process of creating it is not widely known. The information must first be organized before it can be presented graphically. As a newcomer to information design, you are experiencing analysis paralysis at every step of the way: In a limited amount of space, what information should you prioritize? How can you organize data so that it is easy to read? Which graph type is best suited to a specific story? What colors best represent the emotions you are attempting to convey? To address these pressing concerns, we've included some of the best books on infographics to help you on your way to mastering data storytelling.
-
Before joining TASCHEN in 2001, Julius Wiedemann studied graphic design and marketing and worked as an art editor for newspapers and design magazines in Tokyo. His books include the Illustration Now! and Record Covers series, as well as a collection of infographics and books about advertising and visual culture.
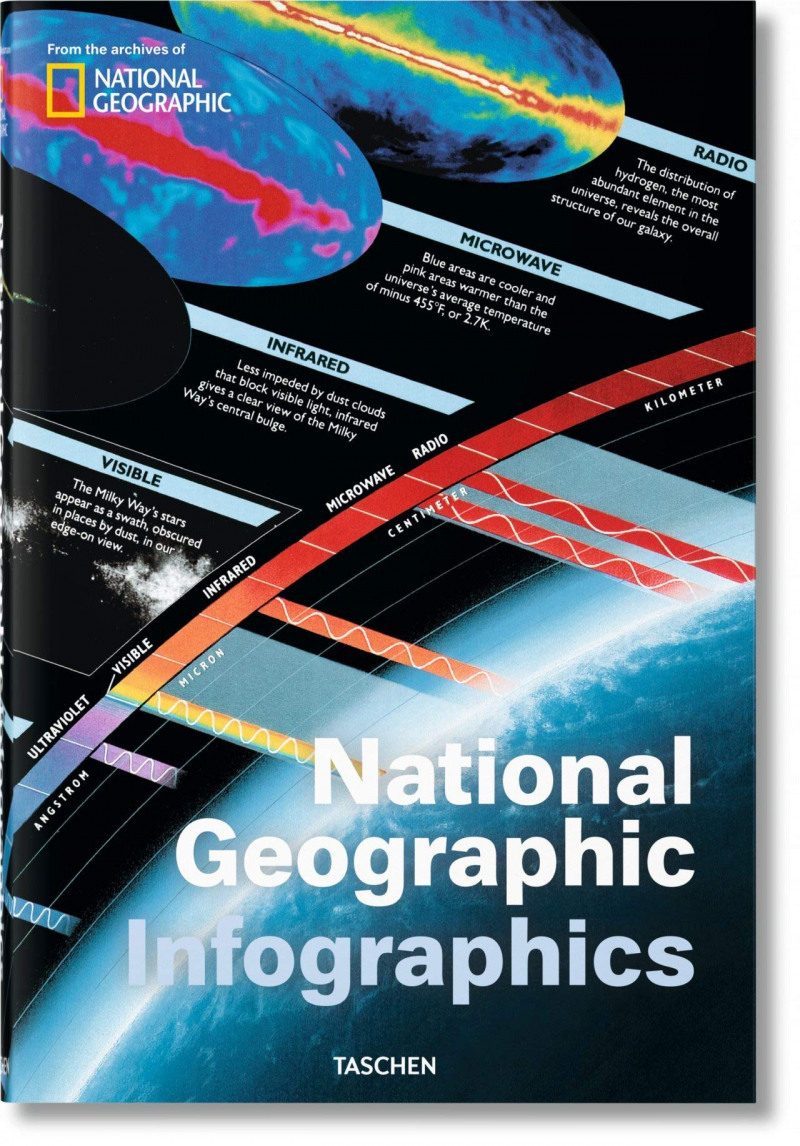
National Geographic began its mission to reveal the wonders of history, popular science, and culture to eager audiences around the world when the information age was a distant dream and the world was a more mysterious place. The world has changed since that 1888 launch; empires have risen and fallen, and a galaxy of information is now only a click away. But National Geographic endures; its calm, authoritative voice is as respected as ever in the midst of our daily data overload.
TASCHEN and National Geographic have compiled the best infographics from the magazine's 128-year history in this new anthology. We learn about the rise and fall of the Roman Empire, the mysterious origins of the Easter Island statues, Cleopatra's Alexandria, and the anatomy behind a cheetah's extraordinary speed in seven sections: History, The Planet, Being Human, Animal World, World of Plants, Science & Technology, and Space. We learn how our genetic patterns have evolved over time and how birds make music; we confront global warming and explore our ever-expanding study of an ever-expanding universe.
Among the best books on infographics, National Geographic Infographics is a defining record of one of the world's best-known publications as well as a beautifully presented repository of accessible discovery and learning, with an essay by Nigel Holmes charting the evolution of National Geographic over the decades and its pioneering use of graphics, as well as five fold-outs mimicking original pull-outs or inserts in the magazine. National Geographic Infographics, which visualizes the histories, facts, and figures that make up our planet and species, remains true to the magazine's original mission as ever: an anchor of knowledge and a wunderkammer of discovery for young and old alike.
Author: Julius Wiedemann
Link to buy: https://www.amazon.com/dp/3836545950
Ratings: 4.8 out of 5 stars (from 124 reviews)
Best Sellers Rank: #679,495 in Books
#240 in Design History & Criticism
#320 in Historical Geography
#473 in Research Reference Books
https://www.amazon.com/ 
https://www.amazon.com/ -
At the Library of Congress, John W. Hessler is a Specialist in Computational Geography and Geographic Information Science. He is a Fellow of the Royal Geographical Society and the author of over 100 books and articles.
Daniel Crouch is the owner of Daniel Crouch Rare Books and a rare book dealer. He has given numerous maps and atlases lectures, including talks at the Library of Congress, the Minneapolis Institute of Arts, and the Houston Fine Arts Museum.
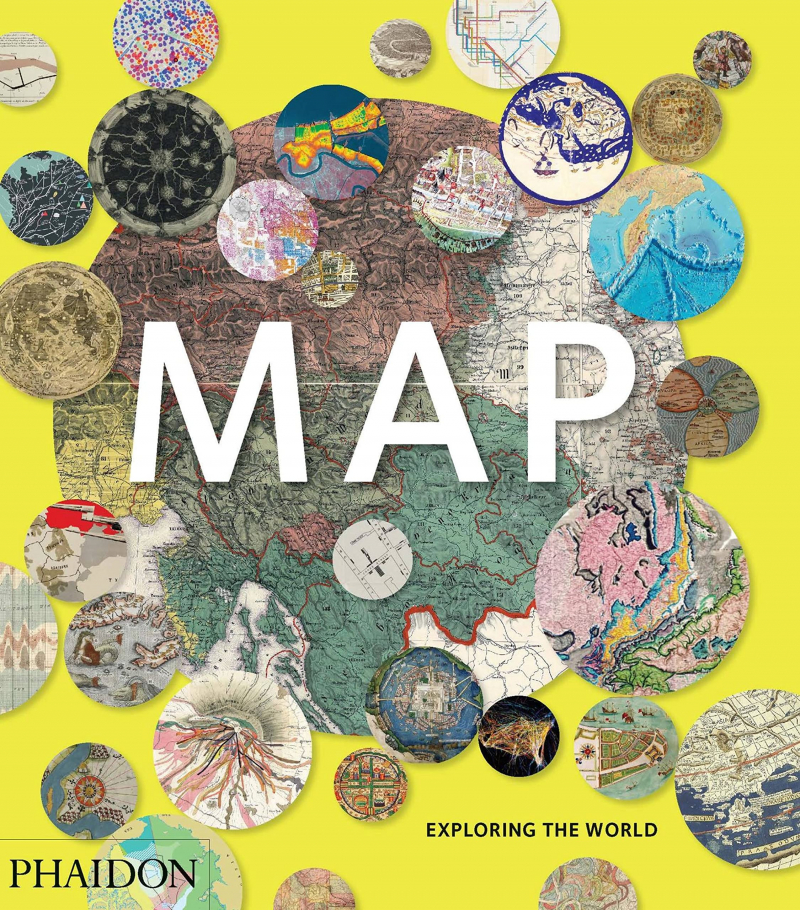
It should come as no surprise that maps are the most ancient type of infographic. Spatial navigation is a crucial evolutionary skill that both animals and humans have developed. Recording this knowledge in maps necessitates a thorough scientific understanding as well as considerable artistic ability. This stunning coffee table book is an unforgettable and timeless journey through the field of cartography. It traces the evolution of maps from prehistoric times to modern brain scans from the Human Connectome Project.
Map: Exploring the World collects over 300 fascinating maps ranging from the dawn of cartography to cutting-edge digital maps of the twenty-first century. The book's unique layout, with maps arranged in complementary or contrasting pairs, reveals how our attempts to create flat representations of the world have been full of beauty, ingenuity, and innovation.
The maps were chosen by an international panel of curators, academics, and collectors to reflect the many reasons people make maps, including finding their way, asserting ownership, recording human activity, establishing control, encouraging settlement, planning military campaigns, and demonstrating political power. The selection includes maps from indigenous cultures around the world, rarely seen maps from lesser known cartographers, and maps of outstanding beauty and surprising individuality from the current generation of map makers, as well as maps from the greatest names in cartography, such as James Cook, Gerard Mercator, Matthew Fontaine Maury, and Phyllis Pearsall.
Author: Phaidon Editors, John W. Hessler and Daniel Crouch
Link to buy: https://www.amazon.com/dp/0714869449
Ratings: 4.4 out of 5 stars (from 125 reviews)
Best Sellers Rank: #404,370 in Books
#52 in Cartography
#187 in History of Engineering & Technology
#415 in History of Technology
https://www.amazon.com/ 
https://www.amazon.com/ -
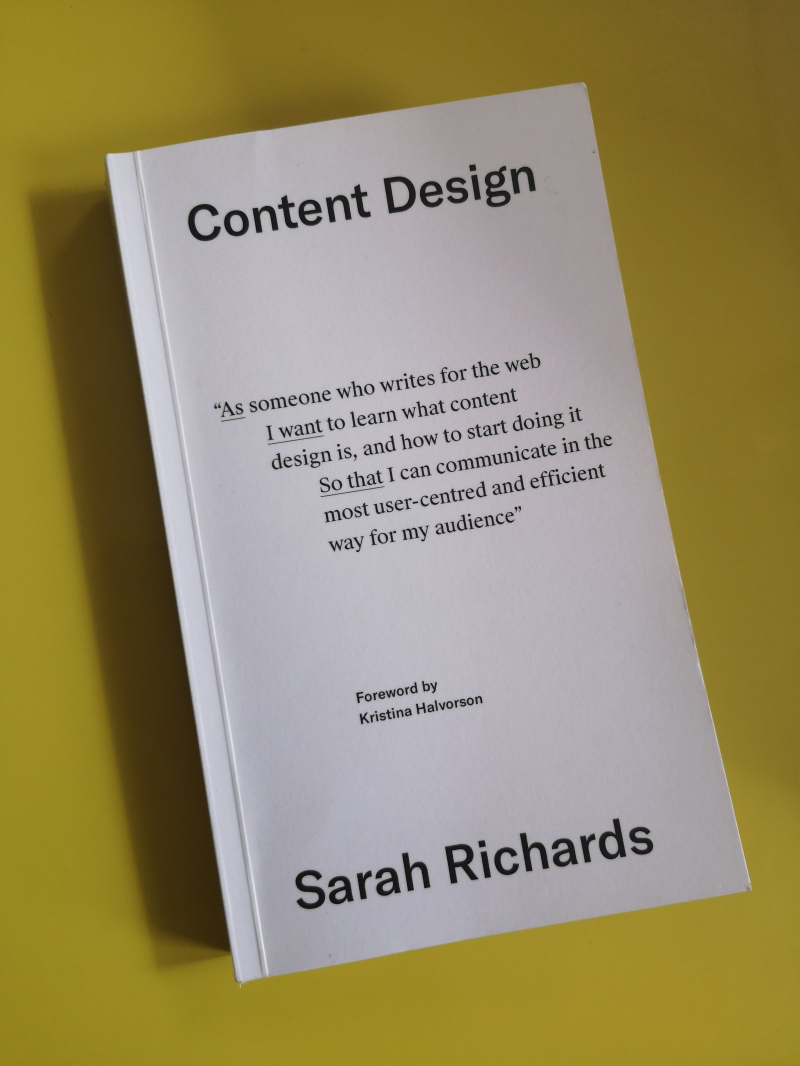
Sarah Richards, who was born in Guildford, Surrey, began her career as a researcher for a local television company before transitioning into copywriting. Richards now runs the Content Design Center, where he consults, coaches, and trains businesses and governments all over the world.
Between 2010 and 2014, Sarah Richards and her team at the United Kingdom's Government Digital Service accomplished the seemingly impossible: they consolidated over 400 separate government websites into a single site designed to effectively serve its users. They established a new discipline in the process: content design.
Content design is not just another name for graphic design or copywriting. Content design is concerned with what content best serves the needs of the users, whether it is written text, infographics, visuals, videos, or charts. Content Design in plain English includes numerous examples of how to create content that draws readers to a website (rather than just pushing content outwards). It is regarded as one of the best books on infographics.
The needs of the users are at the heart of content design, which means determining what your users want. It is also about analyzing data to determine when, where, and how users want to consume information. In content design, there is no room for assumptions—success or failure is determined by how well you understand your users' needs. Discover the power of creating entirely user-centered content, based not on what organizations believe their users want, but on the needs, actions, and motivating forces of your site visitors.
Author: Sarah Richards
Link to buy: https://www.amazon.com/dp/1527209180
Ratings: 4.7 out of 5 stars (from 237 reviews)
Best Sellers Rank: #724,641 in Books
#412 in Web Design (Books)
#2,906 in Internet & Social Media
#54,409 in Reference (Books)
https://twitter.com/ 
https://mhurrell.co.uk/ -
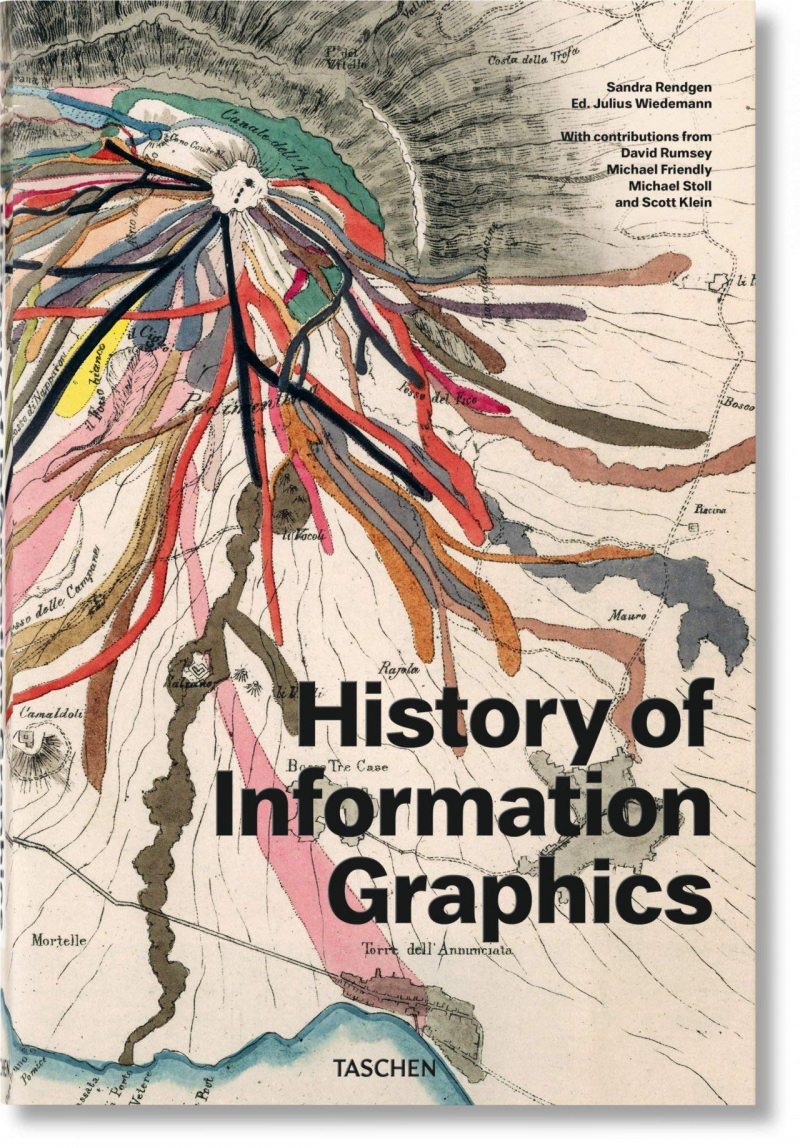
Sandra Rendgen studied cultural studies and art history in Berlin and Amsterdam. Her work as an editor and in developing concepts for media installations focuses on the intersection of image culture and technology, with a particular emphasis on data visualization, interactive media, and the history of how information is communicated. She wrote TASCHEN's Information Graphics and Understanding the World.
Before joining TASCHEN in 2001, Julius Wiedemann studied graphic design and marketing and worked as an art editor for newspapers and design magazines in Tokyo. His books include the Illustration Now! and Record Covers series, as well as a collection of infographics and books about advertising and visual culture.
Information graphics have swept center stage in the age of big data and digital distribution, when news travels ever further and faster and media outlets compete for a fleeting slice of online attention. They distill abstract ideas, complex statistics, and cutting-edge discoveries into succinct, compelling, and masterful designs that are both nuanced and neat. Cartographers, programmers, statisticians, designers, scientists, and journalists have created a new area of expertise in knowledge visualization.
This XL-sized book delves into the history of data graphics from the Middle Ages to the digital era. Sandra Rendgen has curated a collection of 400 milestones in astronomy, cartography, zoology, technology, and other fields. In History of Information Graphics, the author systematically dissect each work's historical context, including highlights like Martin Waldseemüller's famous world map, Ernst Haeckel's meticulous nature studies, and many unknown treasures, across medieval manuscripts and parchment rolls, elaborate maps, splendid popular atlasses, and early computer-based information design.
Following the best-selling Information Graphics and Understanding the World, this third volume fills a void as an unprecedented reference book for data nerds, designers, historians, and anyone thirsty for knowledge. An enthralling investigation into the teachings, research, and lives of previous generations.
Author: Sandra Rendgen and Julius Wiedemann
Link to buy: https://www.amazon.com/dp/3836567679
Ratings: 4.6 out of 5 stars (from 90 reviews)
Best Sellers Rank: #139,787 in Books
#62 in Design History & Criticism
#363 in Graphic Design Techniques
#9,022 in Reference (Books)
https://www.amazon.com/ 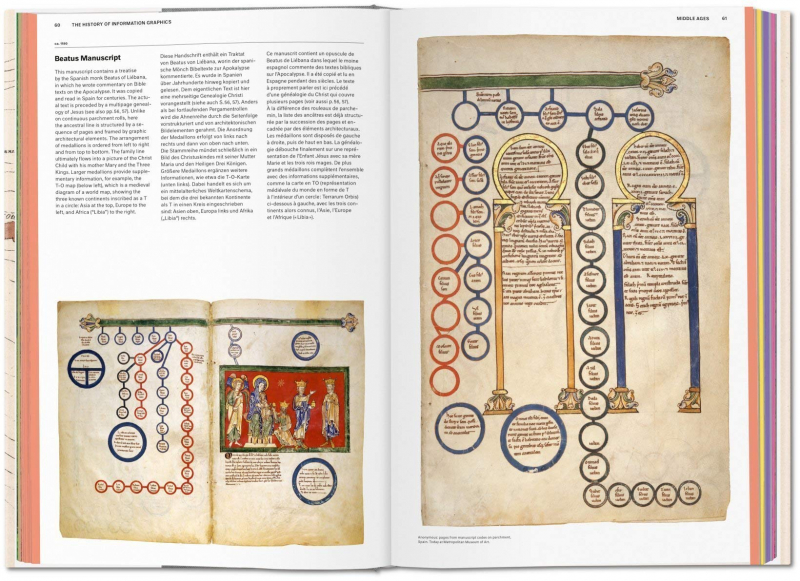
https://www.amazon.com/ -
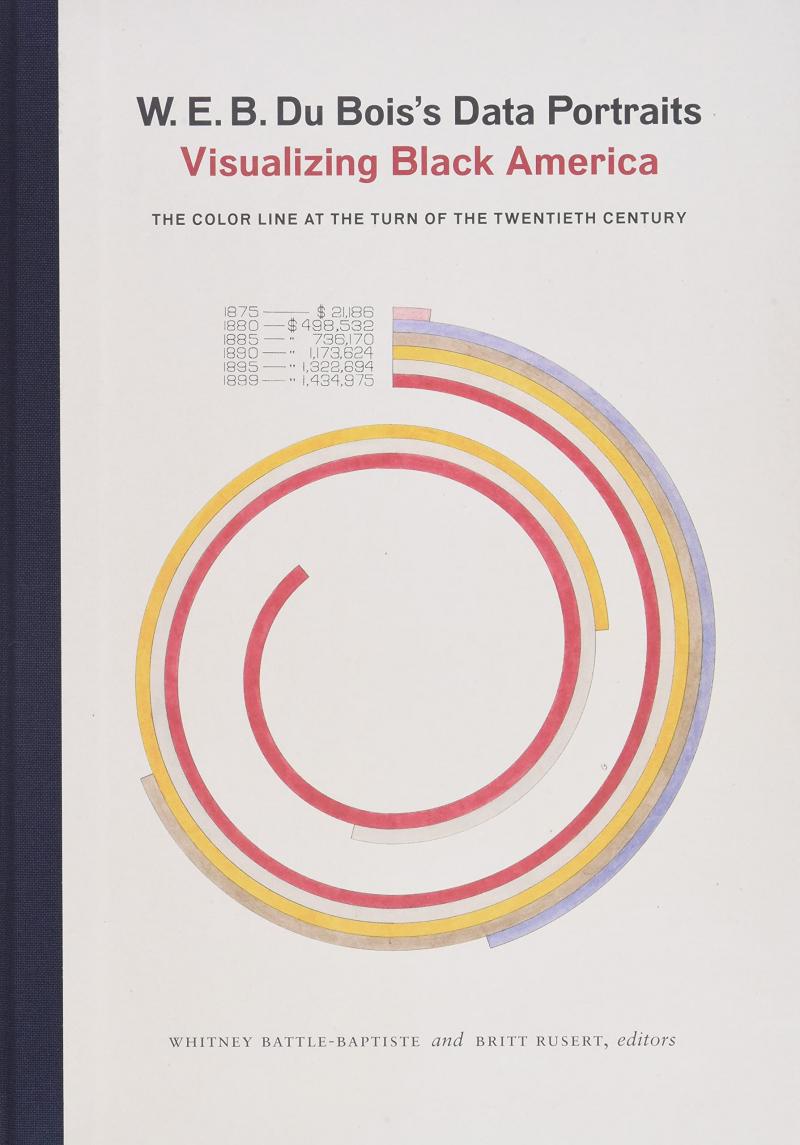
Whitney Battle-Baptiste is the director of the W. E. B. Du Bois Center and an associate professor in the Department of Anthropology at the University of Massachusetts Amherst. She wrote the book Black Feminist Archaeology.
Britt Rusert is an assistant professor at the University of Massachusetts Amherst's W. E. B. Du Bois Department of Afro-American Studies and the author of Fugitive Science: Empiricism and Freedom in Early African American Culture.
The first complete publication of W.E.B. Du Bois's groundbreaking charts, graphs, and maps presented at the 1900 Paris Exposition is W.E.B. Du Bois's Data Portraits. It is among the best books on infographics.
With his exhibition of data visualizations at the 1900 Paris Exposition, renowned sociologist, writer, and Black rights activist W.E.B. Du Bois fundamentally changed the representation of Black Americans. These data portraits, which are both beautiful in design and powerful in content, highlight a wide range of African American culture, from educational advancements to the lingering effects of slavery. They depict a literal and figurative representation of what he famously referred to as "the color line," which is now available in full color for the first time.
A seminal work in social history, graphic design, and data science.
- Data visualization, visualization, and infographics that are decades ahead of their time
- Colorful graphs and charts that are mesmerizing works of art in their own right
- Aldon Morris, Silas Munro, and Mabel O. Wilson contribute to this valuable companion to W.E. B. Du Bois's The Souls of Black Folk.
Data Portraits by W.E.B. Du Bois is an informative and provocative history, data, and graphic design book that continues to captivate audiences today.
Author: The W.E.B. Du Bois Center at the University of Massachusetts, Britt Rusert and Whitney Battle-Baptiste
Link to buy: https://www.amazon.com/dp/1616897066
Ratings: 4.9 out of 5 stars (from 421 reviews)
Best Sellers Rank: #48,601 in Books
#73 in Black & African American History (Books)
#191 in African American Demographic Studies (Books)
#422 in U.S. State & Local History
https://www.amazon.com/ 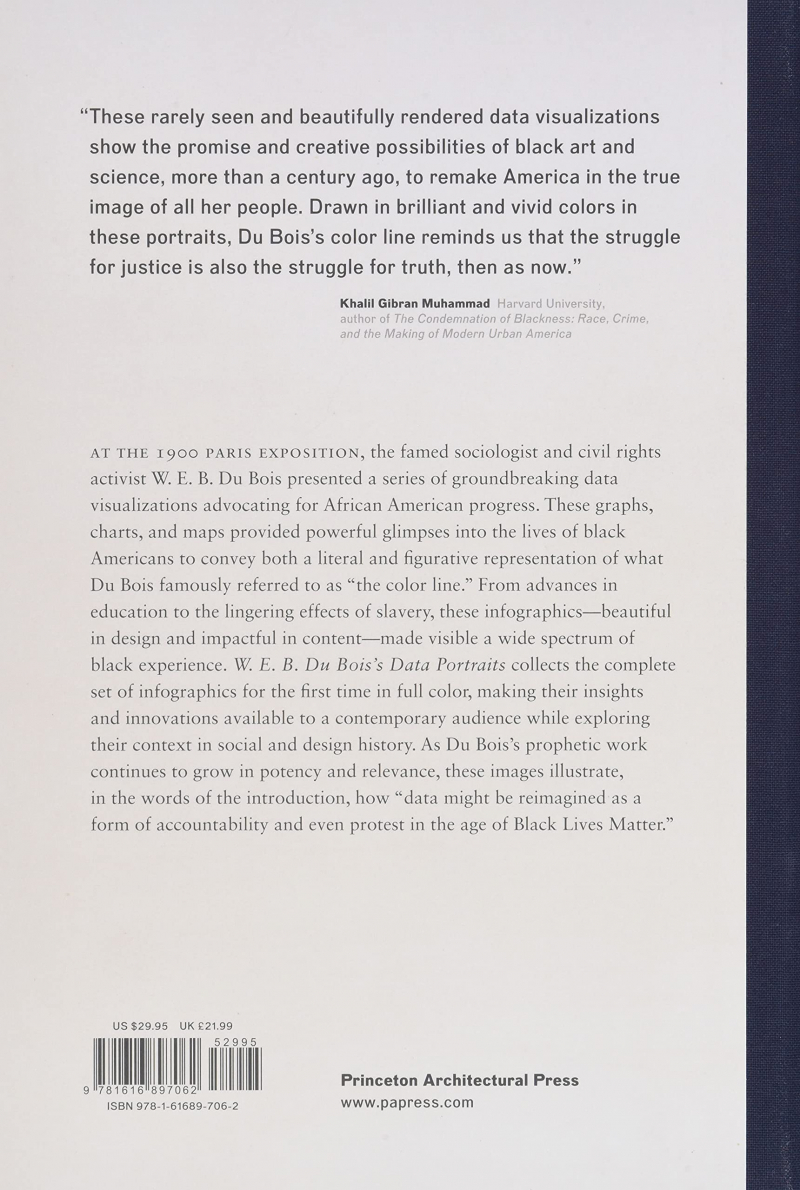
https://www.amazon.com/ - Data visualization, visualization, and infographics that are decades ahead of their time
-
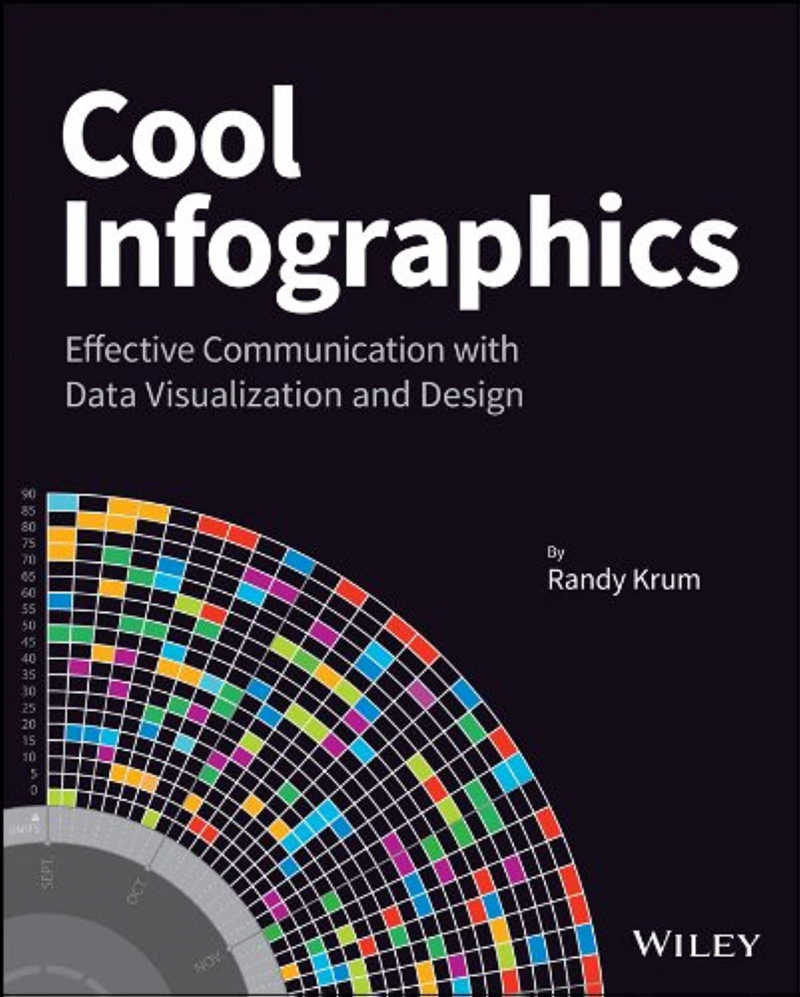
Randy Krum is the founder and president of InfoNewt, a company that specializes in infographic design and data visualization, as well as the creator of Cool Infographics (coolinfographics.com). He creates infographics for online publications as well as internal communications, and he advises on how to create infographic landing pages, social sharing links, infographic SEO, reach key influencers, and track results.
According to research, visual information is more quickly and easily understood, and it is much more likely to be remembered. Cool Infographics explains the design process and the best software tools for creating communicative infographics. The book, which includes a special section on how to create the increasingly popular infographic resume, provides graphic designers, marketers, and business professionals with essential information on the most effective ways to present data.
- Explains why infographics and data visualizations are effective.
- Shares the tools and techniques for producing excellent infographics.
- Covers marketing infographics used online, such as social media and search engine optimization (SEO)
- demonstrates how to market your skills using a visual, infographic resume
- Investigates the numerous internal business applications of infographics, such as board meeting presentations, annual reports, consumer research statistics, marketing strategies, business plans, and visual explanations of products and services to your customers.
You'll learn how to create infographics to successfully reach your target audience and tell clear stories with your data with Cool Infographics.
Author: Randy Krum
Link to buy: https://www.amazon.com/Cool-Infographics-Effective-Communication-Visualization/dp/1118582306/
Ratings: 4.3 out of 5 stars (from 138 reviews)
Best Sellers Rank: #89,708 in Books
#1 in Computer Graphics
#11 in Graphics & Multimedia Programming
#93 in Computer Graphics & Design
https://www.amazon.com/ 
www.carousell.sg -
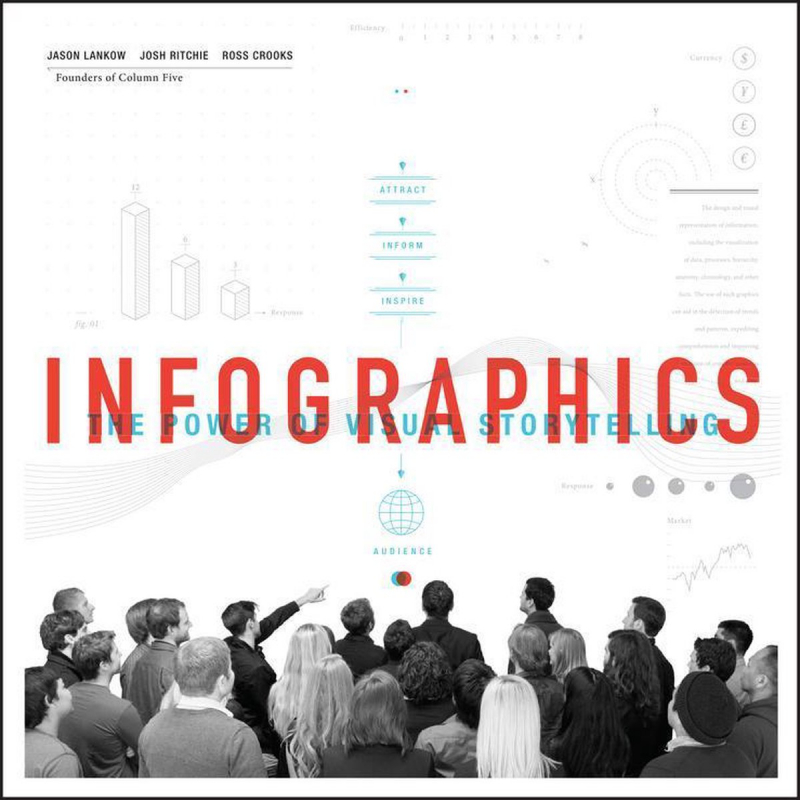
Column Five, a leading creative agency specializing in infographic design, data visualization, and social PR, was founded by Lankow, Crooks, and Ritchie. They've worked with hundreds of clients from various industries, including GE, Intuit, Microsoft, Sony, eBay, and the World Bank. Fast Company, the Atlantic, TIME, Forbes, the Wall Street Journal, and GOOD magazine have all featured their work. They frequently give talks on the subject of infographics, most recently at the Federal Reserve and the AIGA (American Institute of Graphic Arts), and they teach a course on Visualization of Information at Columbia University.
In today's fast-paced world, you must communicate your message in a concise and engaging manner that distinguishes it from the noise. Infographics and data visualization, for example, can help with this. Infographics: The Power of Visual Storytelling, with DIY functionality, will teach you how to find stories in your data and visually communicate and share them with your audience for maximum impact. The book is considered one of the best books on infographics.
By creating informative and shareable infographic content, infographics will demonstrate the vast potential of using the communication medium as a marketing tool.
- Learn how to use strong illustration to explain an object, idea, or process, capturing interest and providing instant clarity.
- Learn how to find interesting stories (buried or boring data) and turn them into visual communications that help build brands and increase sales.
Use visual content to communicate with and engage your audience, capture attention, and grow your market.
Author: Jason Lankow
Link to buy: https://www.amazon.com/Infographics-Visual-Storytelling-Jason-Lankow/dp/1118314042/
Ratings: 4.3 out of 5 stars (from 84 reviews)
Best Sellers Rank: #1,072,535 in Books
#3,919 in Communication & Media Studies
#4,508 in Marketing (Books)
https://www.bol.com/ 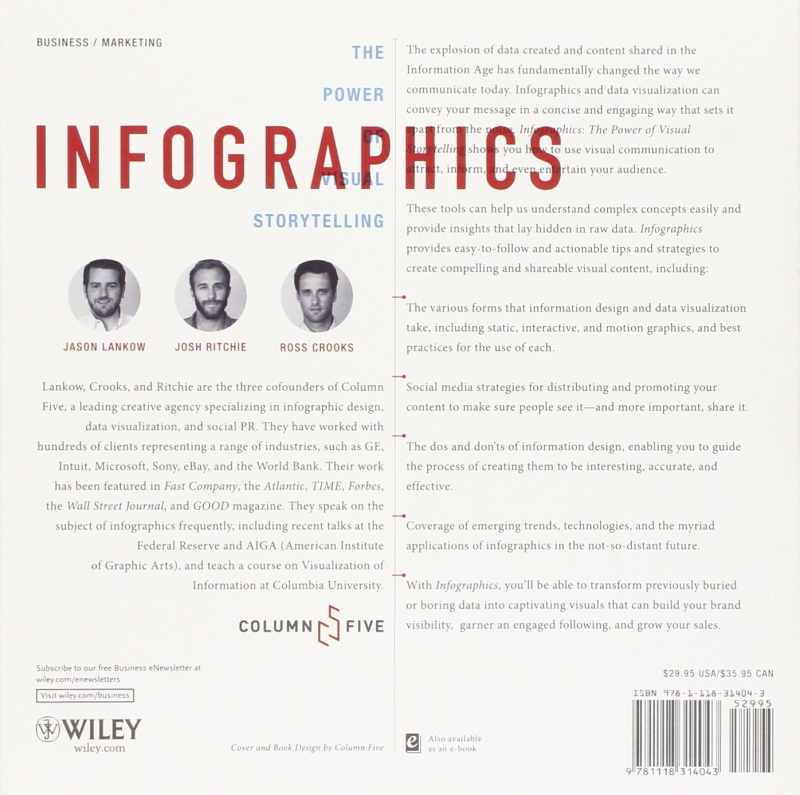
https://www.amazon.com/